
Why LiveOps Feels Unpredictable for Game Designers
How can we run executable hypotheses to understand cause and effect of design decisions in F2P economies?


Welcome to my first blog post of 2026!
There’s been a lot of discussion around LiveOps challenges lately. As a systems designer, I’d like to explore the topic from a game designer’s perspective.
While LiveOps inherently involves multiple layers, I want to highlight certain difficulties faced in game design and product decisions, specifically within the scope of this article:
We want to add the event X from a competitor game into ours, but we do not know how to adapt it to our audience and game economy.
Even though the level funnel is made of the same levels, engagement and monetization metrics change with every release. We cannot explain why.
We believe the new event will work, but we do not know what outcomes we should actually expect from it.
Since these are proven mechanics, we decide which features to add by looking at competitor games. However, the configurations do not fit our game economy well.
The package prices in the competitor game are well balanced. We applied the same setup, yet something still feels wrong because we cannot reach the KPIs we expect.
We built a very similar version of the competitor game and even copied its economy. Why does their game earn money while ours does not?
Should this event unlock at level 40 or level 50? Which level would produce better results?
If we give 75 coins instead of 50 at the end of a level, would it affect our IAP packages? We assume it would not.
Our A/B test results come out trivial even though we changed both price and content of the IAPs significantly. How is that possible?
We want to adjust level difficulty dynamically, but we do not know how to align the reward flow with it.
We currently measure level difficulty purely by intuition, yet we want to tune difficulty across each set of 100 levels. How can we achieve this?
Most of the problems in the list come from weak system design and not being able to form clear hypotheses. Teams are afraid of missing trends, so they make random decisions based on conclusions they think are right. The A/B tests built on top of those conclusions then fail to give clear results. I already covered the last problem in my previous articles if you want to go deeper.
If you have not run into these problems before, congratulations! It probably means you already have a solid pipeline and do not deal with these kinds of headaches. In that case, you can keep reading the rest of the article just for fun!
I divided this article into 3 main sections:
Introduction. In this section, we discuss what executable hypothesis design is and what it is not.
Existing Approaches. In this section, we focus on common issues in game design processes during event design and explore how they can be solved.
Framework Design. In the final section, we discuss a framework that enables systems to communicate with each other and allows us to implement executable hypotheses.
Introduction
Before talking about what executable hypothesis design is, let’s take a look at what it is not:
It is not player simulation.
It does not predict how the player will behave in a situation. It explains which behavior a specific situation could produce.
It is not a prediction model.
A prediction model estimates the outcome using past data, while executable hypothesis design reveals the behavior a hypothesis would produce.
It is not an alternative to analytics.
It is used not to explain past player data, but to test the future. It does not make predictions based on data, but better models can be prepared by being informed by data.
It is not an alternative to A/B testing.
It is not an alternative to A/B testing but a complement to it. It tests the hypothesis before the experiment and shows which parameters are worth trying.
It is not an AI agent or a bot.
It is not an intelligent bot that plays the game. Instead, it is a system that explains the decision-making mechanism.
It is not magic!
To apply executable hypothesis design, we first need to clearly define our in game systems, especially the economic relationships between them. We cannot build sound hypotheses on top of the random behavior produced by a poorly modeled system.
It is not just about resource balancing!
Changes in player engagement and frustration can also be modeled, for example, based on difficulty parameters and reward flow.
Executable hypothesis design is a mathematical hypothesis modeling method used to reason in advance about which behaviors game design decisions will produce. Its strongest aspect is that by running different behavior models together, it makes causal relationships visible that cannot be seen through intuition alone.
Hypotheses can always turn out to be wrong, and it is rarely possible to know with complete certainty until you run an A/B test. Executable hypothesis design is not about proving whether a hypothesis is right or wrong. Instead, it provides a preview of whether the hypothesis can steer the system in the intended direction.
Existing Approaches
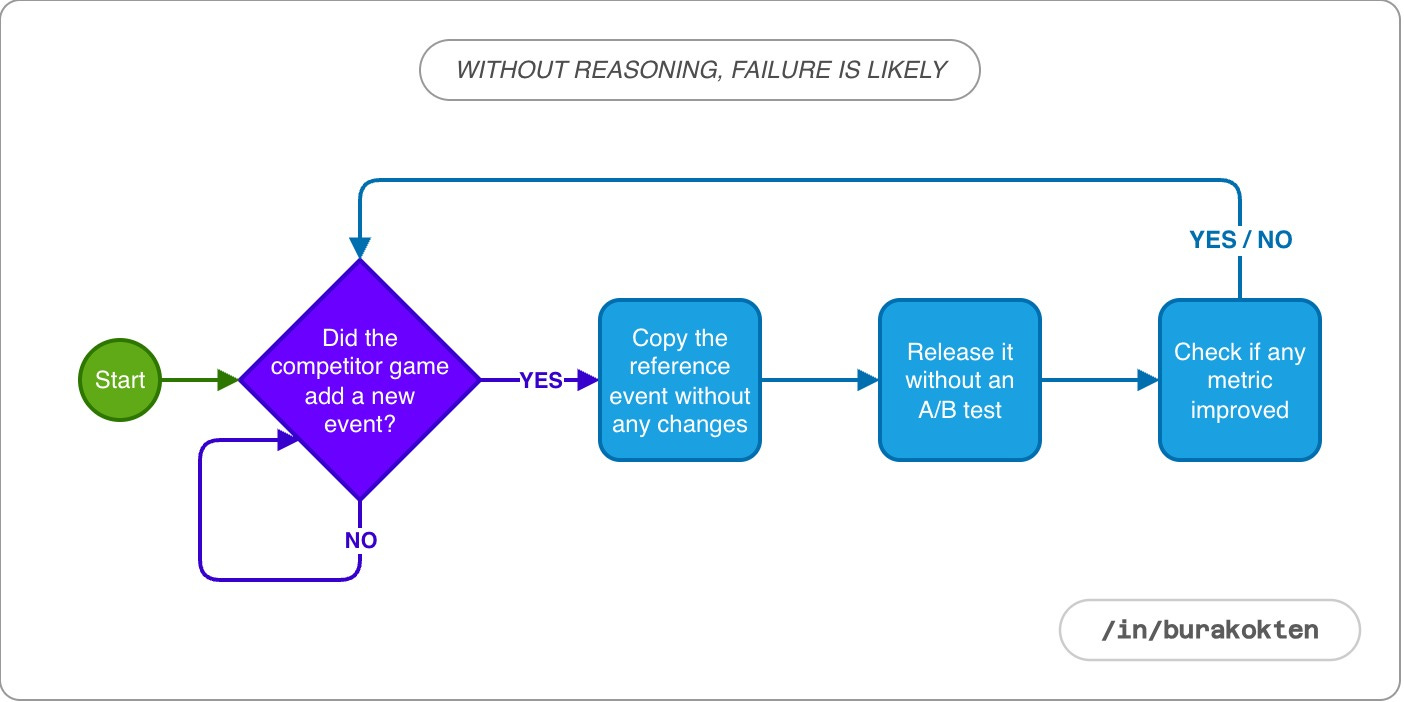
Let’s start with one of the most common mistakes made when developing a new event or feature. A competitor game, usually one that is already established in the market and generating revenue, releases a new event or makes a change in the game. Product teams notice the update and begin preparing to add it to their own game as quickly as possible.
The motivation is often driven by FOMO and the belief that “they must know something if they added it”. In this case, A/B testing is rarely performed. The underlying assumption is that if every mechanic matches the competitor’s game exactly, this game will also succeed.
This is one of the main reasons why so many games fail, even when they try proven mechanics that have already worked in the market.
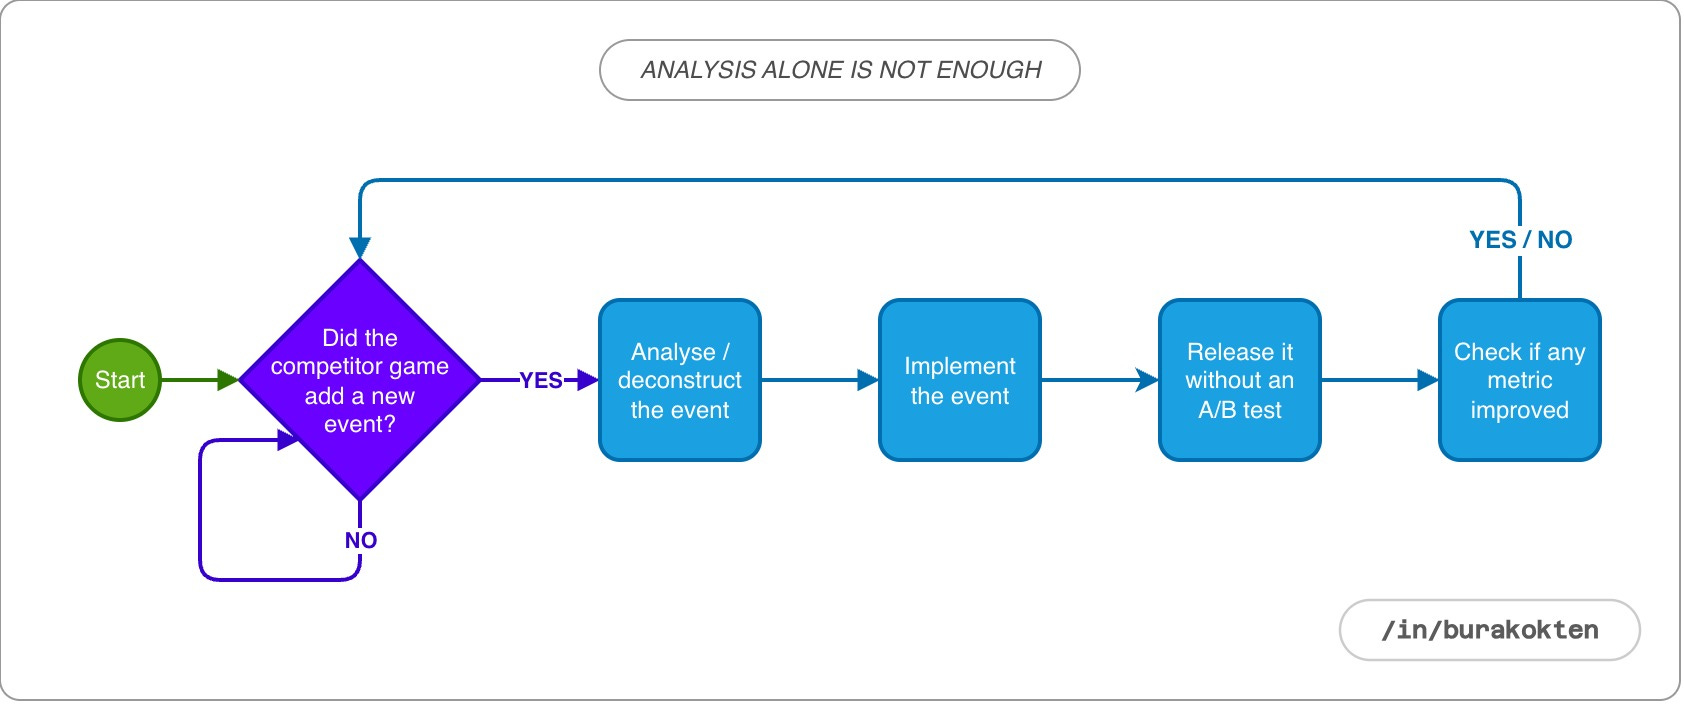
In some studios, this issue is addressed by deconstructing competitor features in detail. The problem is that deconstructions only provide assumptions about the game in which that feature exists, and they are not guaranteed to be accurate. If they were, we would expect all identical games to make money.
Just like a fingerprint, the implementation of a feature is unique to the game it belongs to. From the design phase to development, every step of that implementation is specific to the game in which it is built.
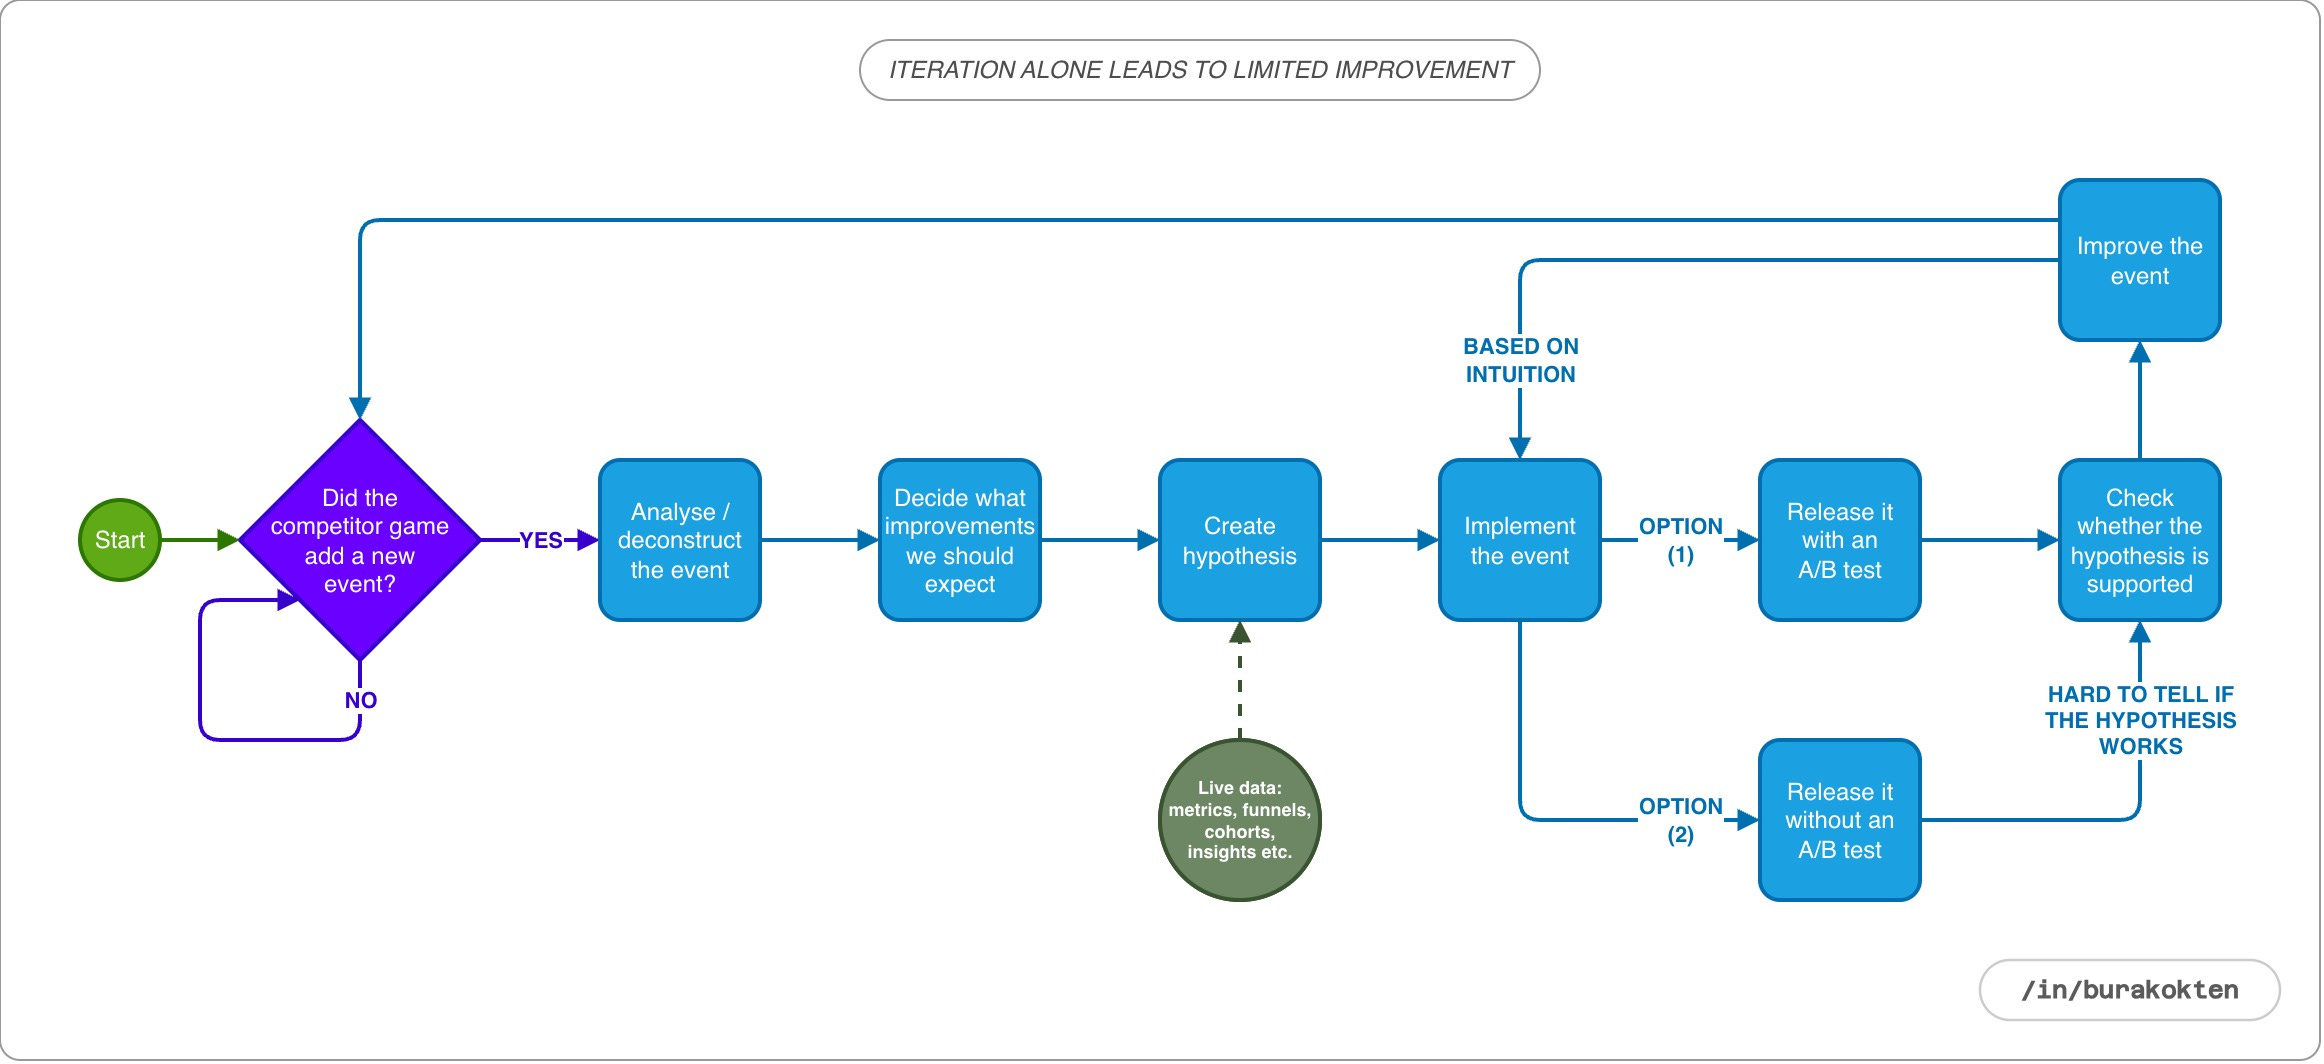
Implementing new features through iteration and A/B testing delivers significant gains compared to the first two approaches. However, this approach assumes that in each iteration we can interpret the event related data correctly and use it to guide the next improvement.
With careful work, this approach can be effective up to a certain point. But when multiple events and other game dynamics are active at the same time, and iterations overlap with different LiveOps periods, the results often reflect what works for that particular moment rather than clearly explaining themselves.
The core issue is that the system itself still cannot be clearly defined on the product or game design side. As a result, the process remains at an intuitive level rather than becoming fully structured and explicit.
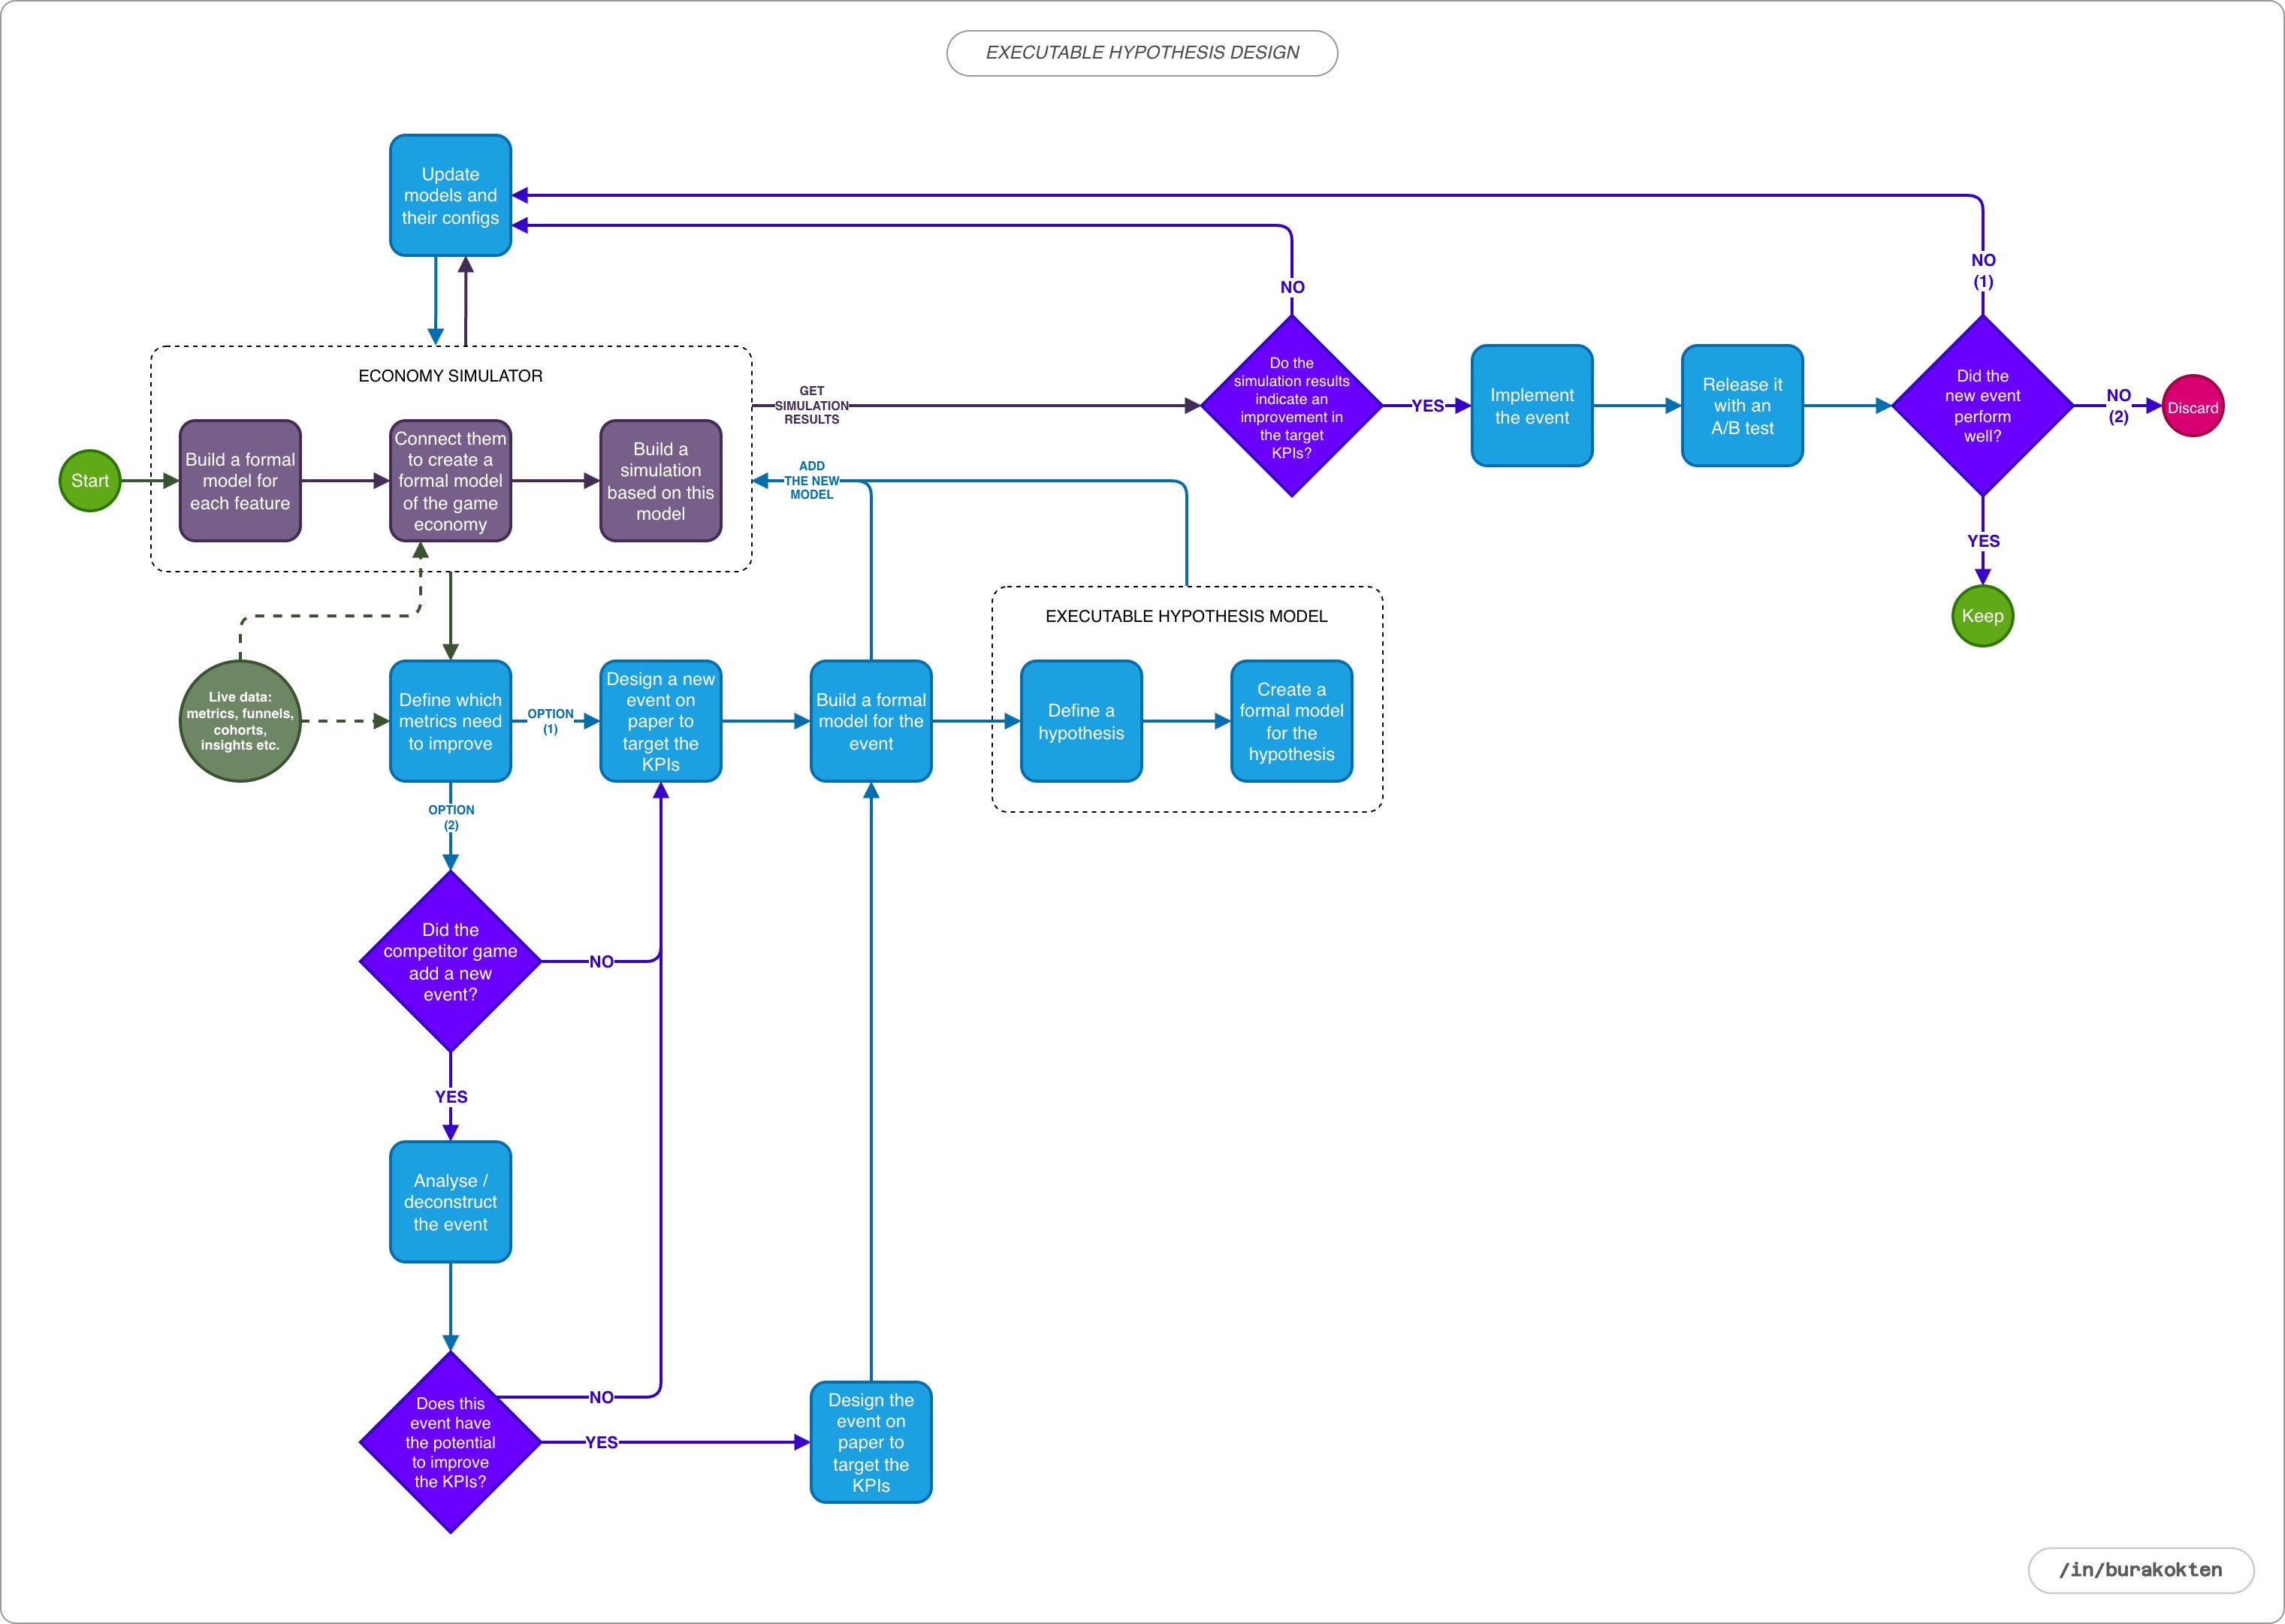
A better solution is actually right in front of us, and it starts with integrating formal models of the systems we already design into a simulation. Although the term formal model may sound academic, it simply means defining each feature we add to the game in terms of its inputs, outputs, and interactions with other features using mathematical rules. When these models run together in an economy simulator, they allow us to balance the game economy even before calibrating it with player data. This is especially useful before launch. However, during LiveOps, things become more complex and require more than this.
At this point, I want to emphasize why it is important to define all features as formal models. Their value goes beyond executable hypothesis design. They are also essential for building a solid bridge between game designers and developers:
There is no gap between what the game designer prepares and what is implemented.
When designing a feature, game designers must think through how it interacts with other systems.
The impact of removing a feature from the system is known at an implementation level, not just intuitively.
Any system’s simulation matches how it behaves in reality. This allows the simulation to be calibrated using real data.
It helps game designers polish the feature before implementation begins.
There is also a commonly misunderstood point that I do not want to skip. For example, you might design a non deterministic chest where the probability of dropping 1000 coins is 10%. However, the real impact of that percentage within the system can only be calculated if we know what proportion of players who have access to the chest actually interact with it. In this case, the chest itself is a sub model. It must be modeled together with the percentage of players in the overall population who open it, as part of a higher level system. These are the kinds of configurations we calibrate once real player data starts to come in.
Sample Hypothesis Model
In this section, without going into too much detail, we will discuss how a simple hypothesis can be expressed as a formal model and what kind of insights it can provide.
For simplicity, I use sample player data from a 100 level range, using average values for each level. In reality, a simulator would run these models for each individual player at every level. Here, however, I only want to illustrate the core logic. For that reason, I made simplifications both in the data and in the assumptions specifically for this example.
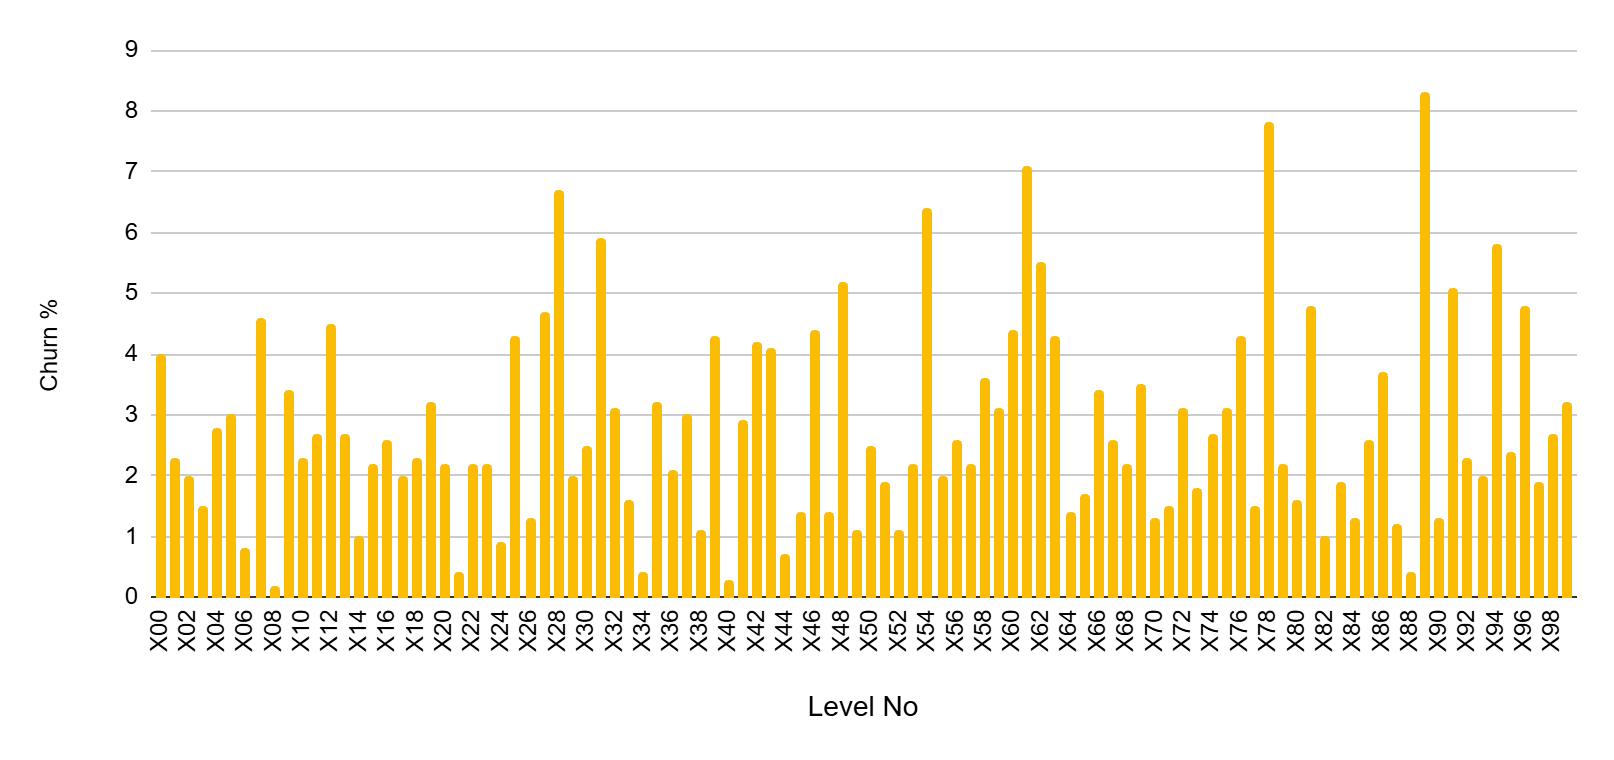
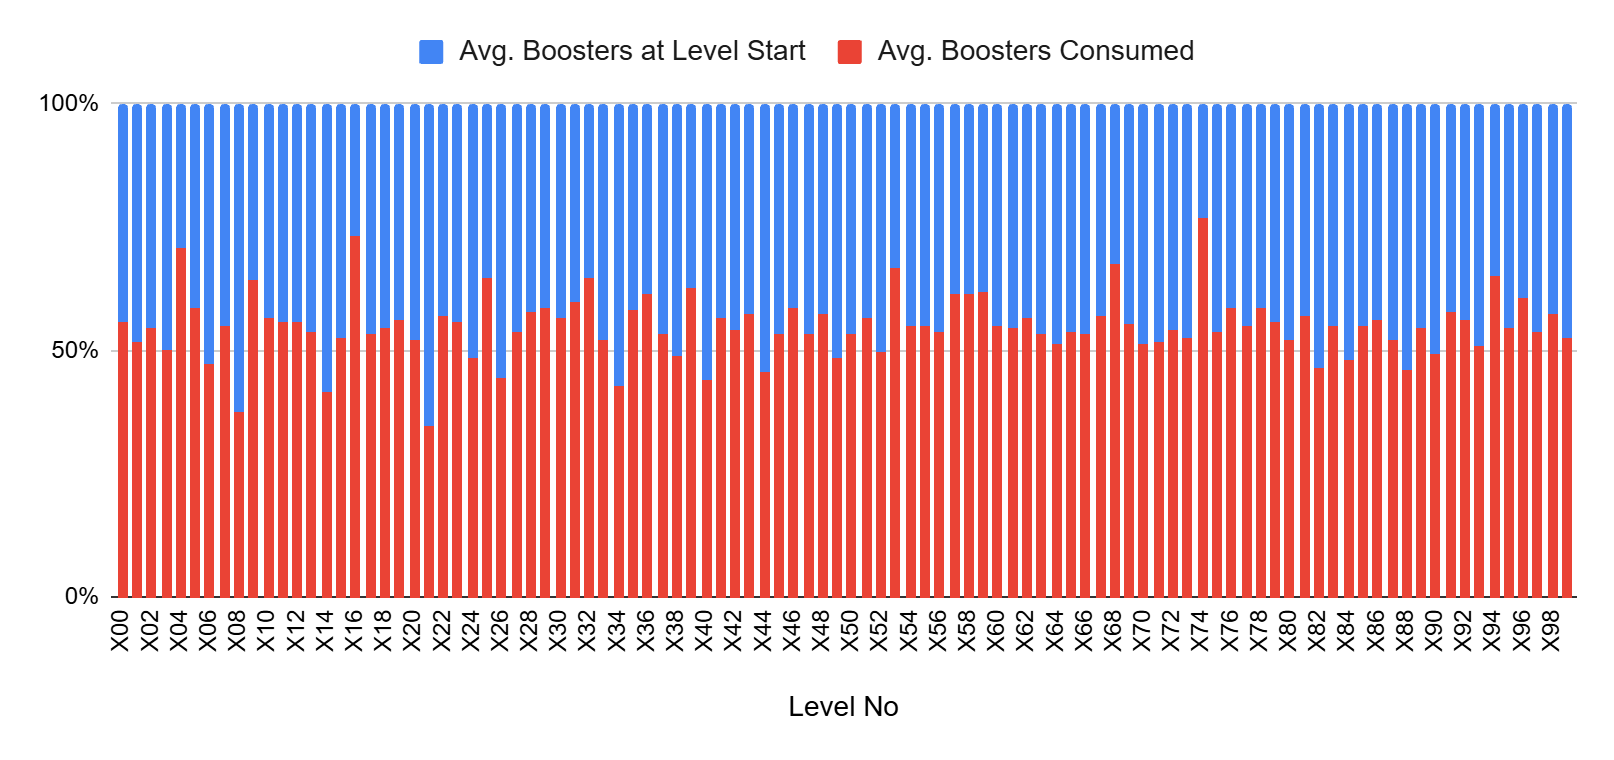
Based on the churn and booster level funnels shown above, assume that you want to reduce churn in levels where it is 5% or higher. Instead of adjusting the level parameters to make those levels easier, you consider reducing churn by introducing additional boosters. Based on this assumption, you form the following hypothesis:
If we add extra boosters to levels with more than 5% churn, churn on those levels will drop, and IAPs on other levels will stay stable. This happens because the change targets local difficulty spikes without affecting the overall economy or spending patterns.
Let’s turn the hypothesis into a formal model and see whether the system actually produces the behavior we expect. I prefer to design these models as white box systems, where the logic is explicit and interpretable. Their parameters can also be calibrated using data through regression or supervised learning.
What we should not forget is this: our goal is not prediction. The goal is to run a consistent and explanatory behavior mechanism in the simulation. We aim to build a mechanism that behaves reasonably.
For this example, we will ignore several factors for the sake of simplicity, such as coin earnings, their exchange into boosters, and the impact of difficulty trends on player engagement. We will also assume that the average booster usage represents the number of boosters required for a player to complete a level. In reality, this value may also be influenced by the boosters used by players who churn. In that case, looking only at the average may not be an accurate approach.
First, let’s think about which state could trigger churn. For this model, I make the following assumptions:
As we move negatively away from the average number of boosters required to complete a level, the probability of churn should increase. As a player, if I do not have enough boosters, I either need to make a purchase or quit the game at that point.
I assume that the churn output produced by this behavior follows a sigmoid function. The fewer boosters players have relative to what is required, the more likely they are to churn. However, if they have enough boosters, or more than enough, that tendency decreases.
Based on these assumptions, we can model churn behavior using the following sigmoid function:
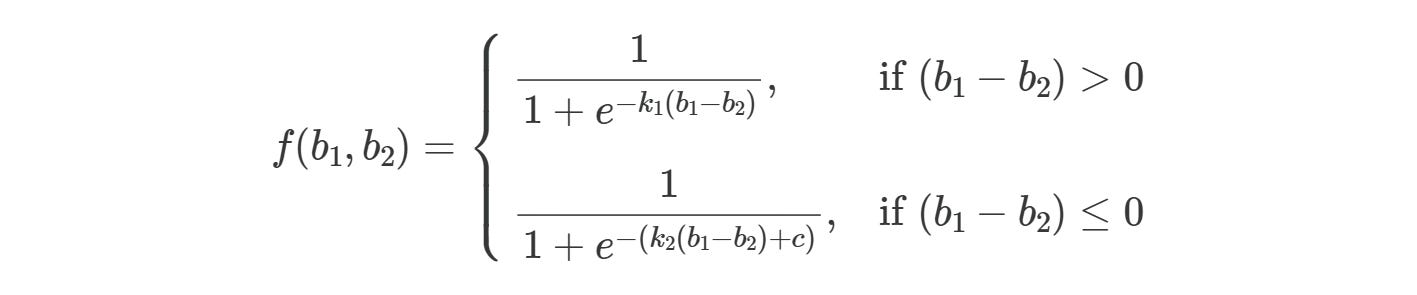
where f(b1, b2) represents the calculated churn value for given b1 and b2, with b1 representing booster consumption and b2 representing boosters at level start. k1, k2, and c are constants to be calibrated.

For the given values, the model explains 81% of the real data. On average, the model’s predictions deviate from the actual values by 19%. For this example, this level of accuracy is sufficient.
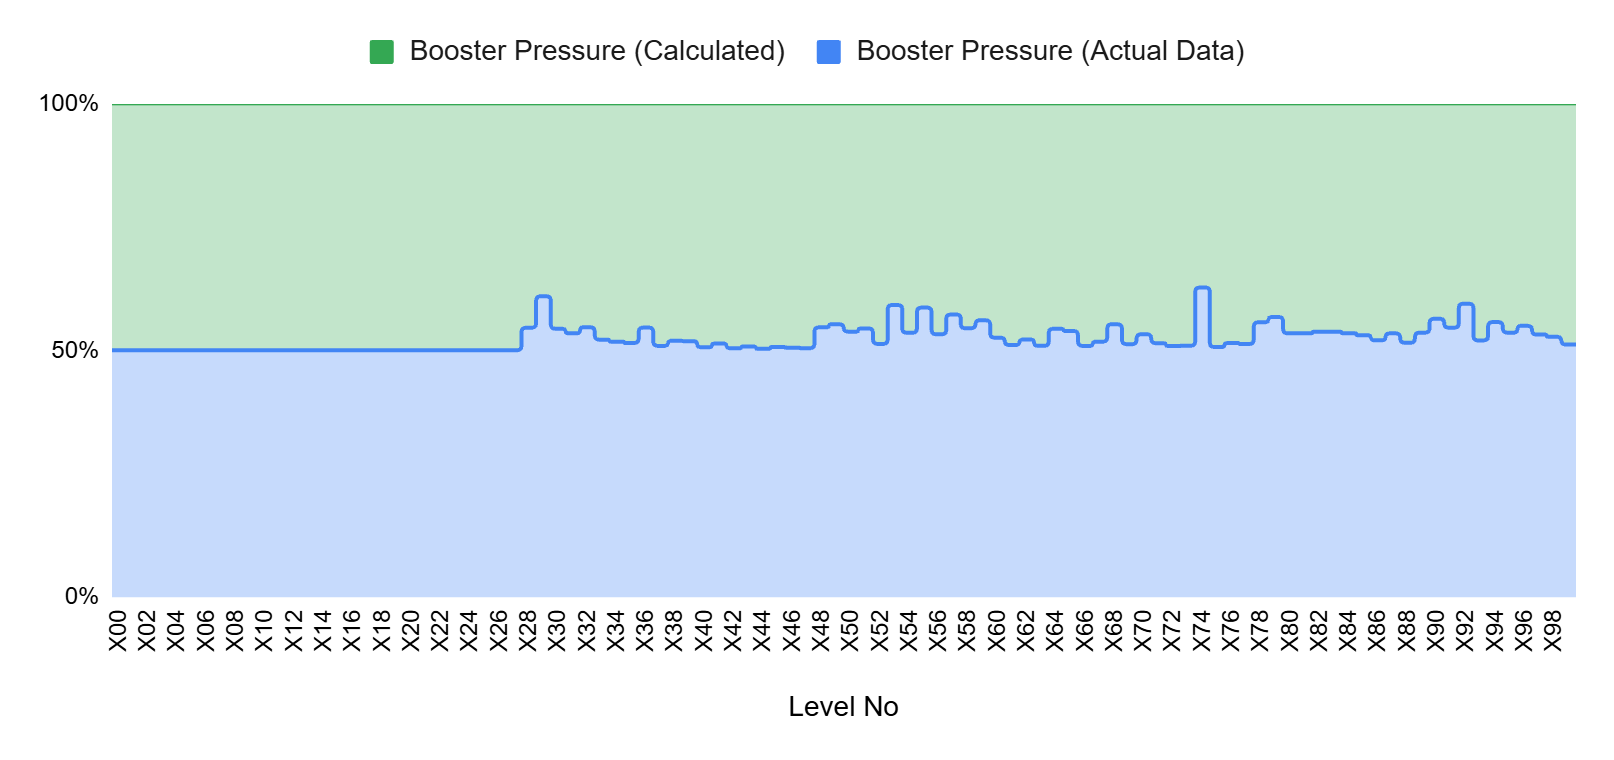
As shown in the chart above, introducing additional boosters only on levels with churn of 5% or higher reduces booster pressure not only on those targeted levels, but also on others where no extra boosters are introduced. The reason is that players who accumulate sufficient boosters may choose not to consume them immediately and instead carry them forward to subsequent levels, indirectly affecting the system as a whole. This is critical because our original hypothesis ignored this possibility. The simulation, however, reveals that it must be monitored carefully.
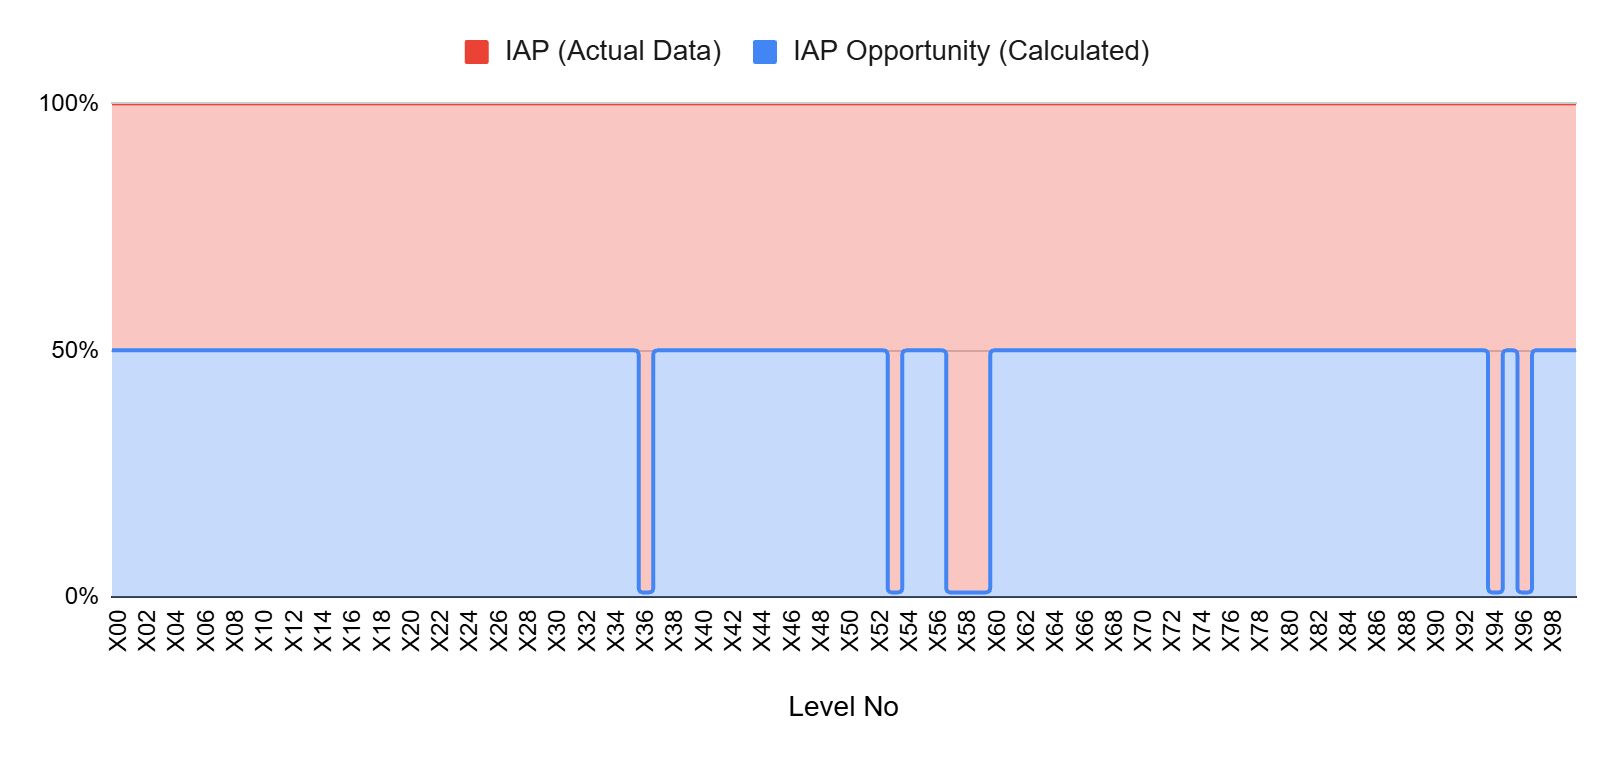
Moreover, actual IAP points decrease in the simulation because the new booster inputs reduce the system’s tendency to generate IAP behavior compared to the original state. As shown in the chart above, IAP opportunity shows a drop on the levels where IAPs were originally made. Previously generated IAPs now have the potential to be lost under the new system behavior.
Even though I did not include the IAP and booster usage models in this article, we should not forget that the simulation runs on these formal models and produces behavior accordingly.
Framework Design
To be able to use formal models, all systems need to speak the same language. There may be more casual ways to achieve this, but designing a framework is always more scalable. It allows new modules to be added or removed when needed.
In this section, I briefly introduce how you can build an economy framework and connect related systems, using a proof of work tool that I developed.
Unit
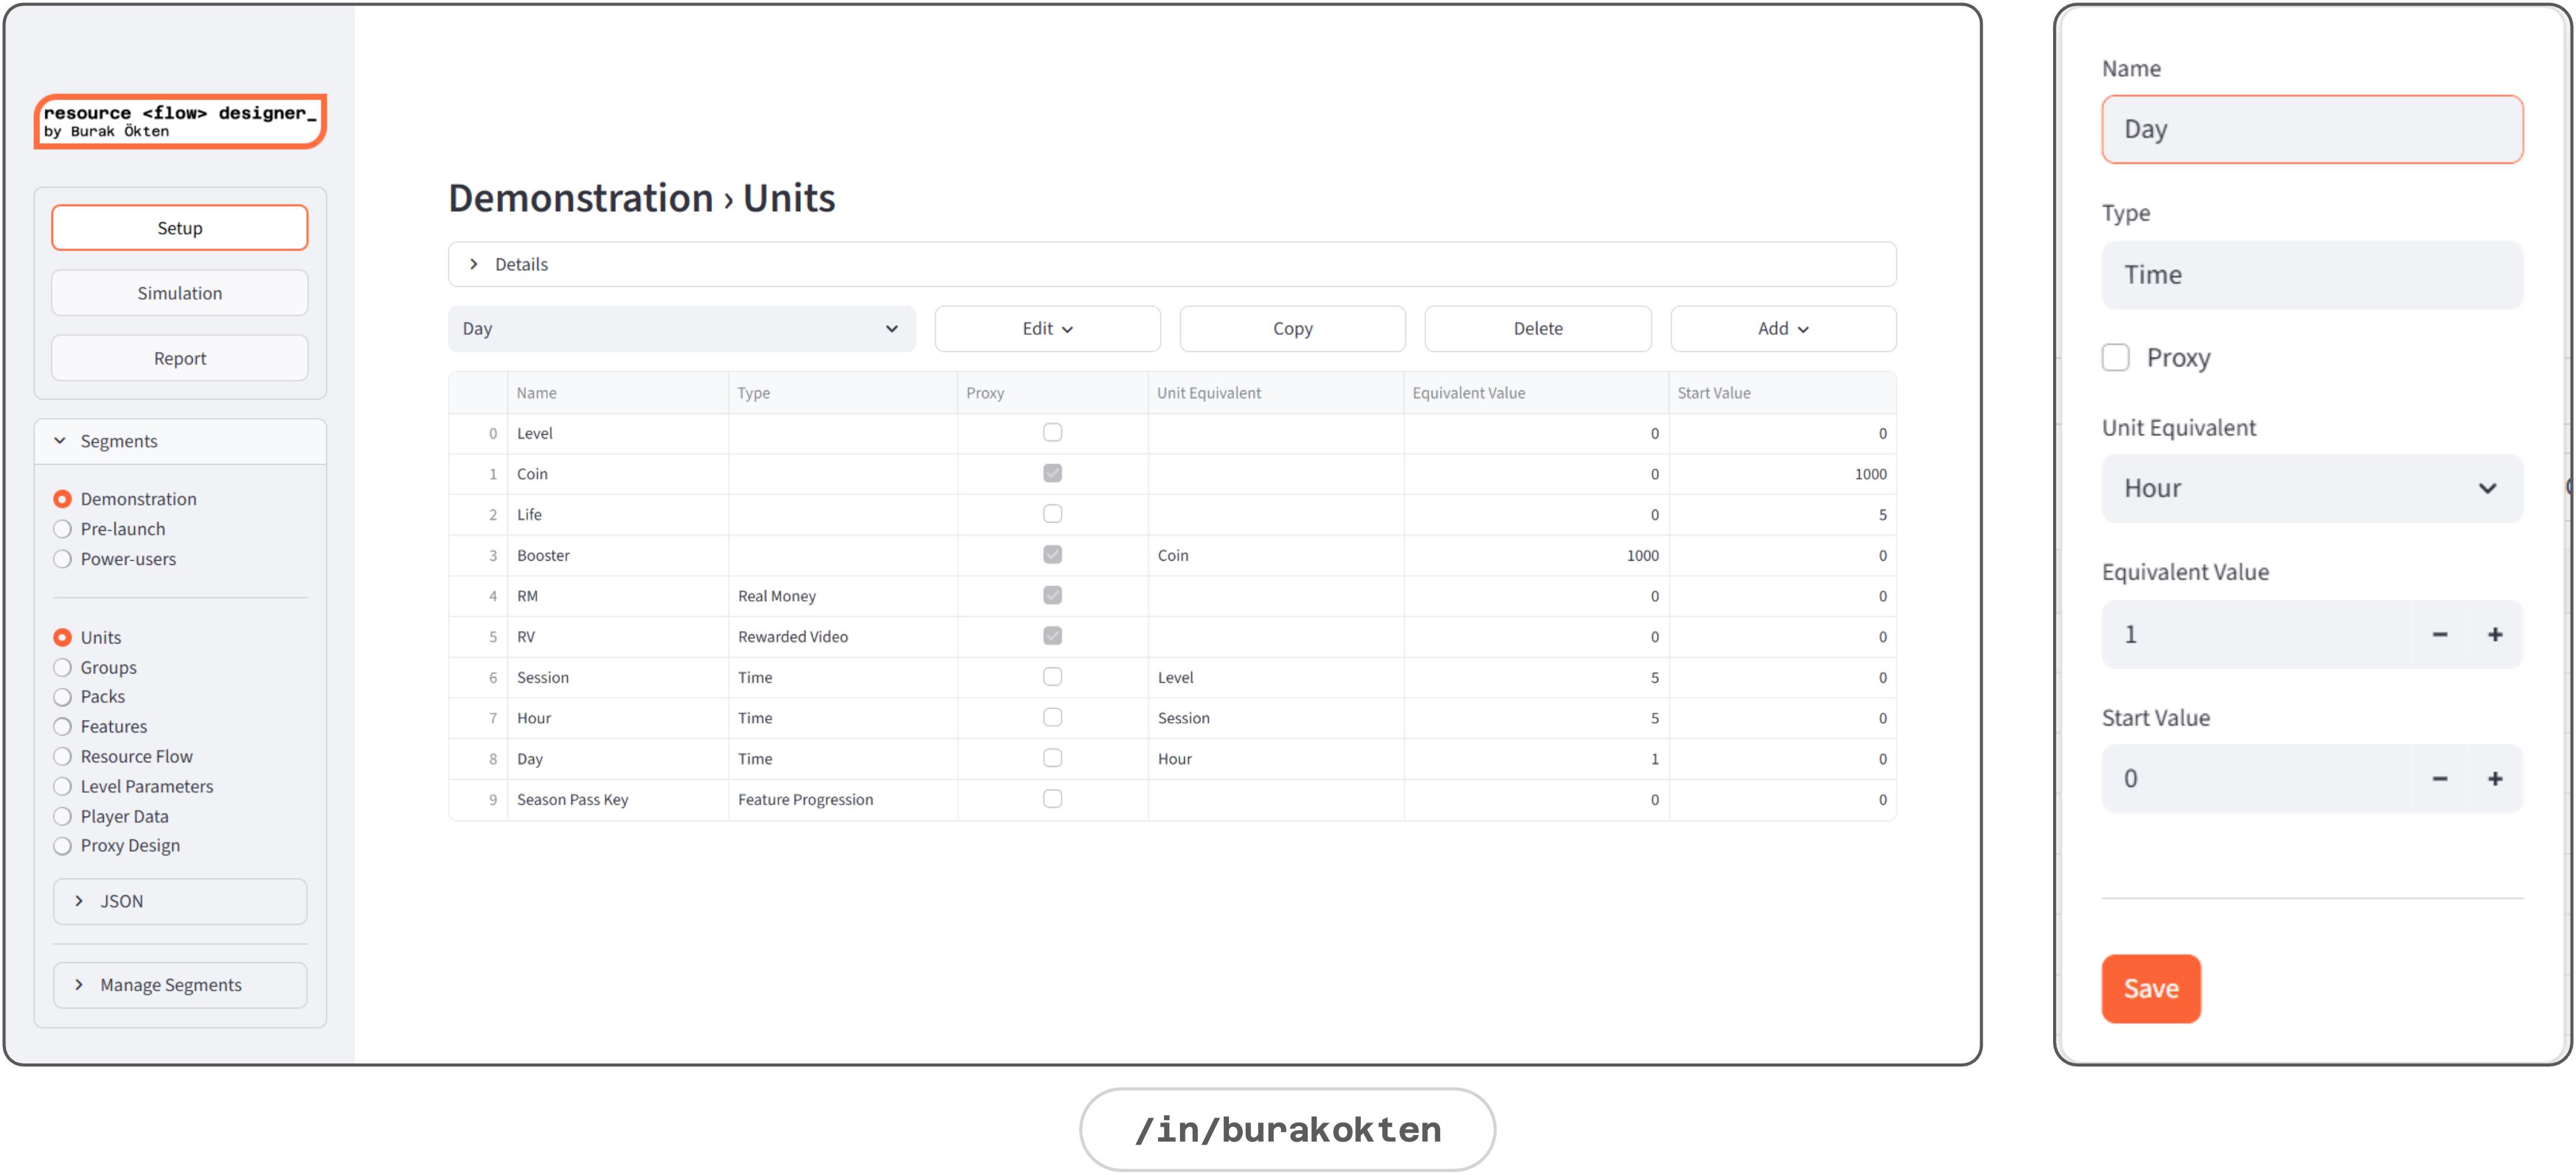
A unit is the core building block of the economy.

Any measurable element is a unit:
Level, coin, life, booster, real money, rewarded video, session, hour, day, event tickets, collectible items and more.A unit can have an equivalent in another unit:
Booster = 1200 Coins
Session = 5 Levels
Day = 4 Sessions etc.
A demonstration of the Units module is given below:
Group
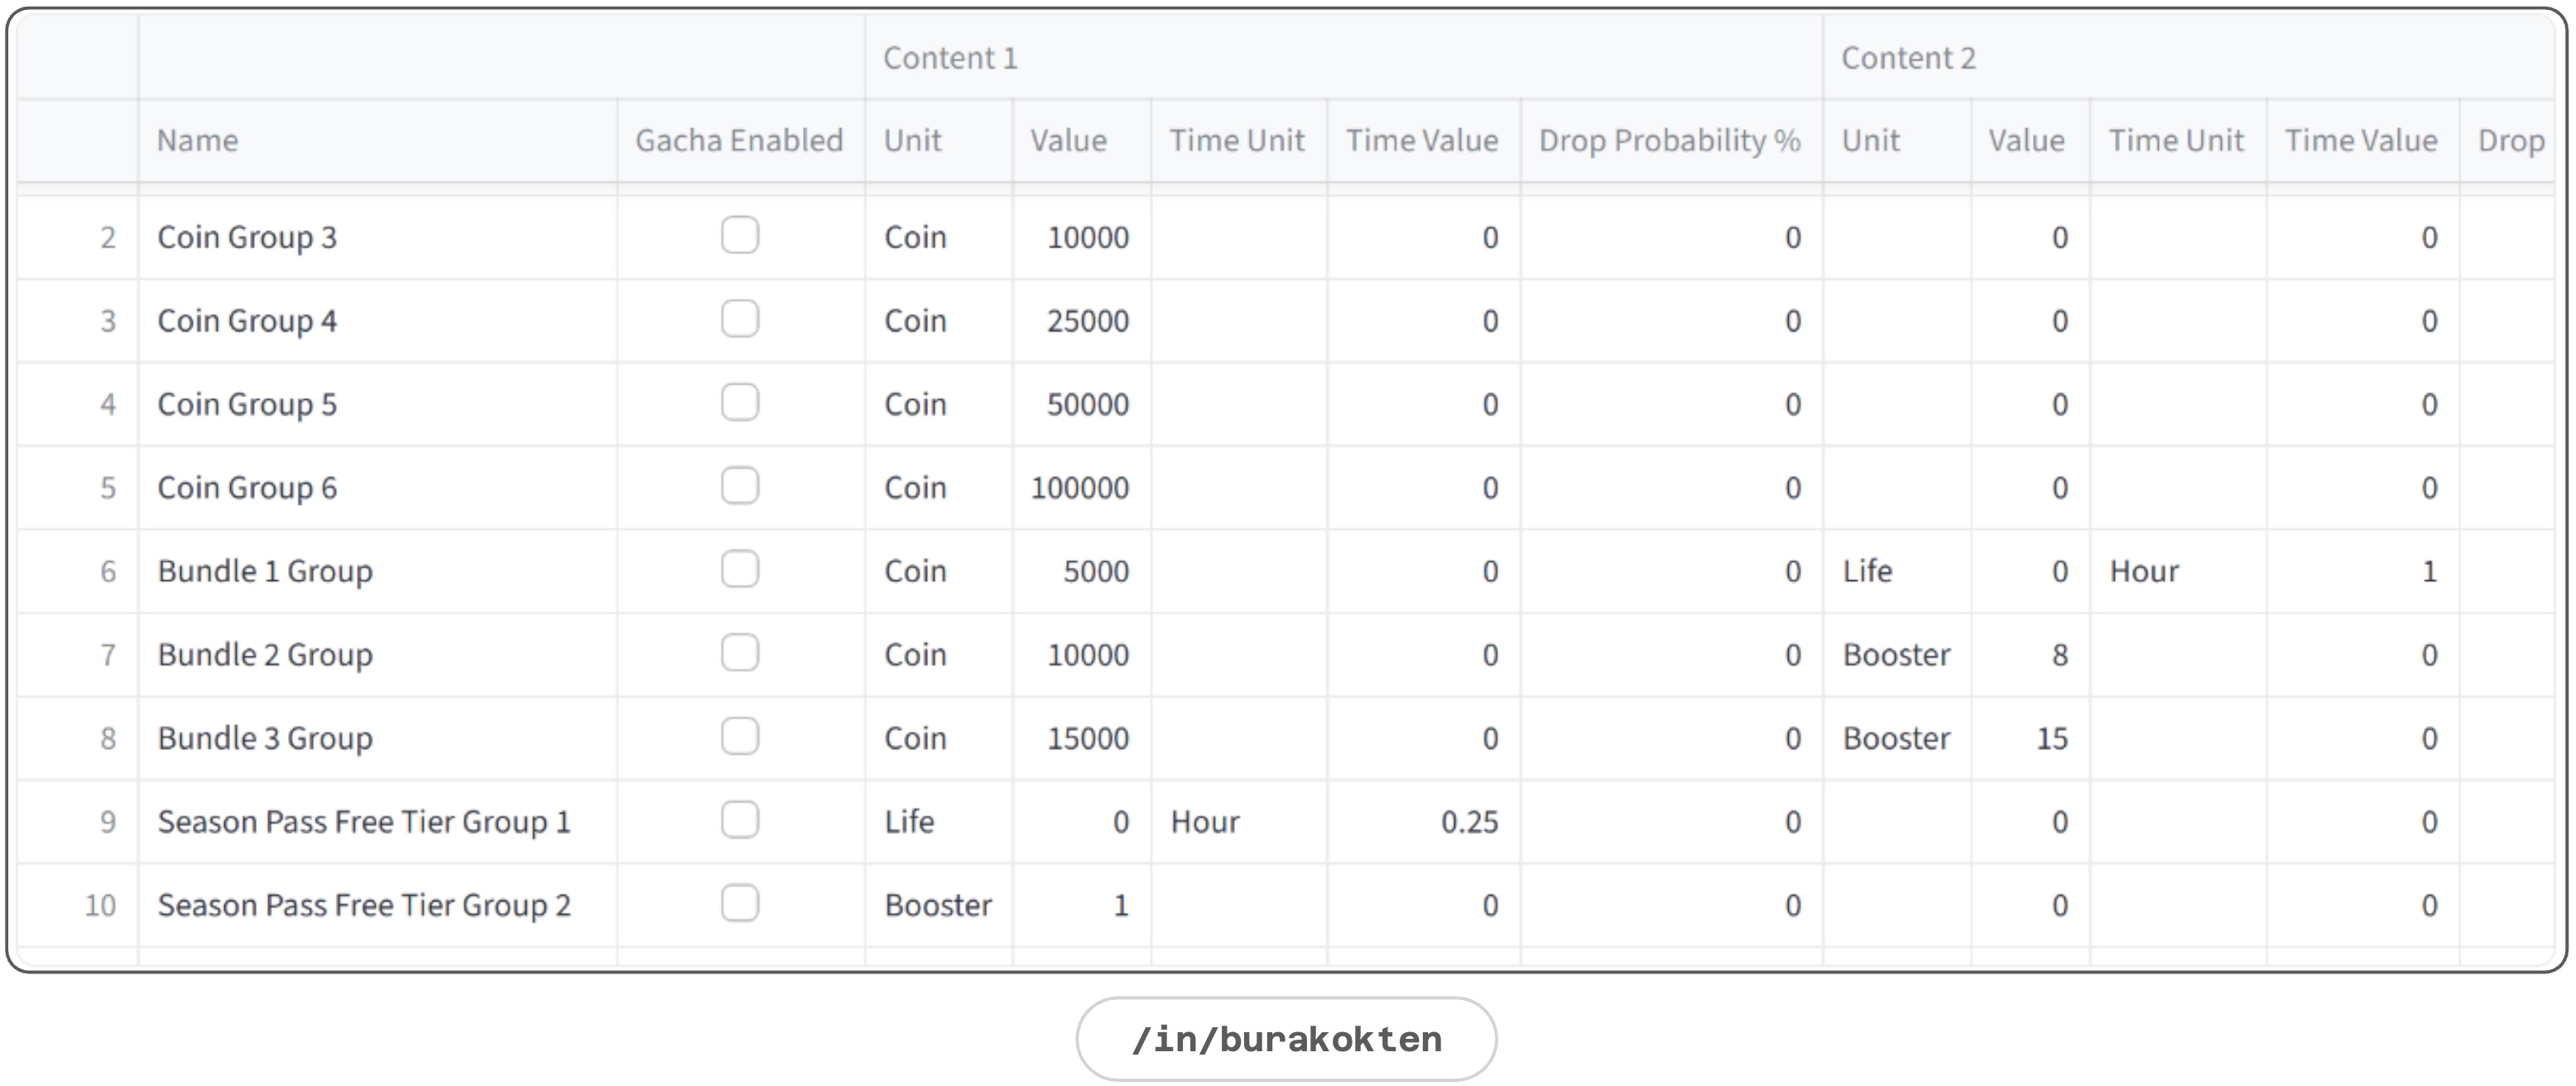
A group is a bucket of units with a gacha mechanic.
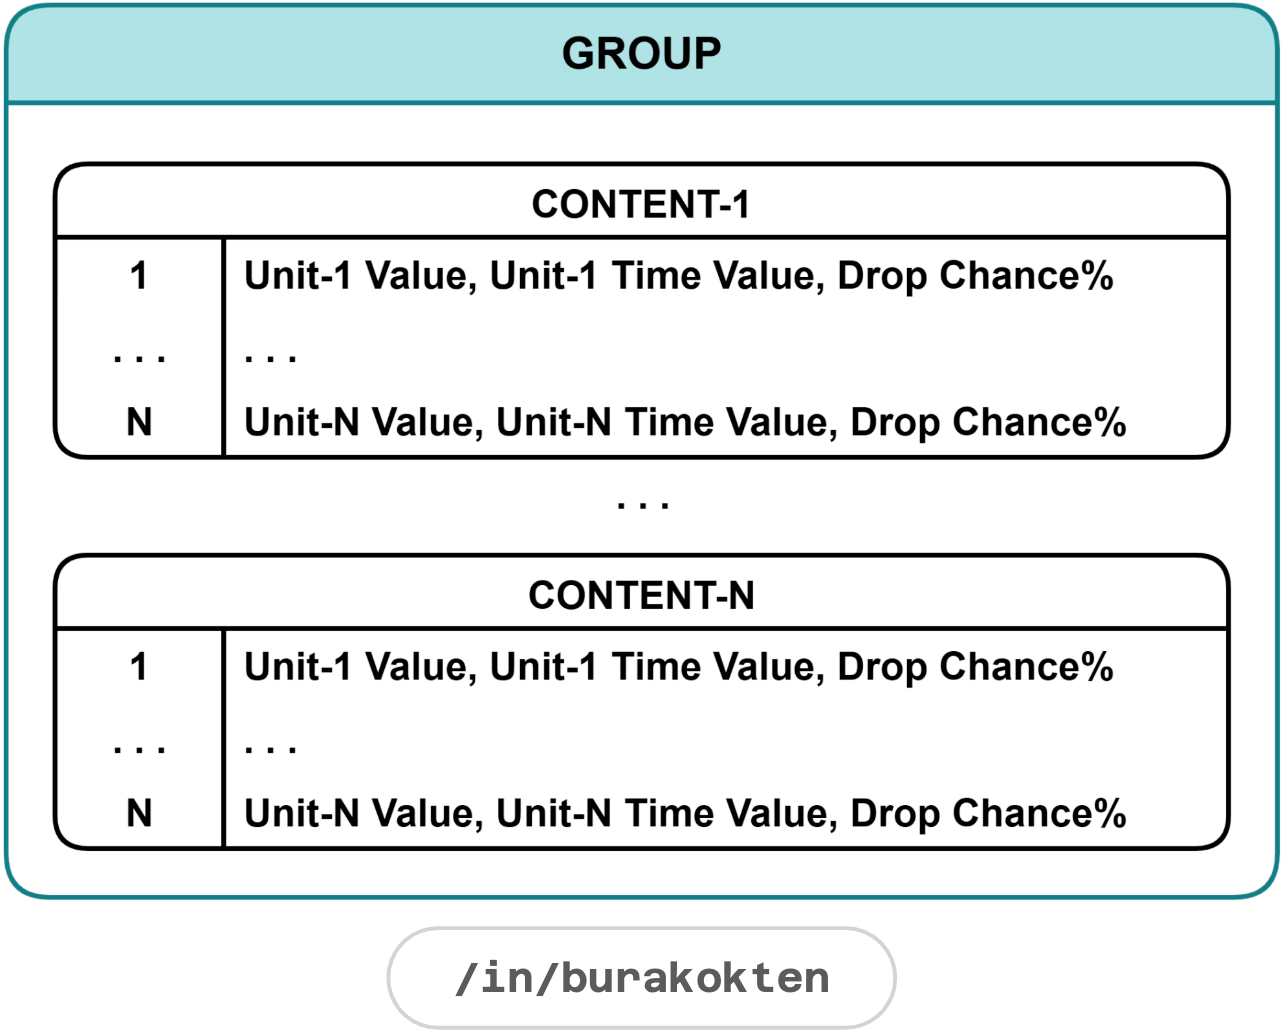
Groups control how many units can flow through an action. Each group can have multiple units, with optional gacha as in the examples:
Group 1: 1000 Coins + 3 Boosters - all content always drop

Group 2: 1000 Coins (50%) - each time there is 50% chance to drop coins

Group 3: 1000 Coins (50%) + 3 Boosters (50%) - each time there is 50% chance to drop either coins or boosters
Time value makes a unit infinite temporarily:
Group 1: 30 Minutes Booster

Group 2: 1000 Coins + 30 Minutes Life
A demonstration of the Groups module is given below:
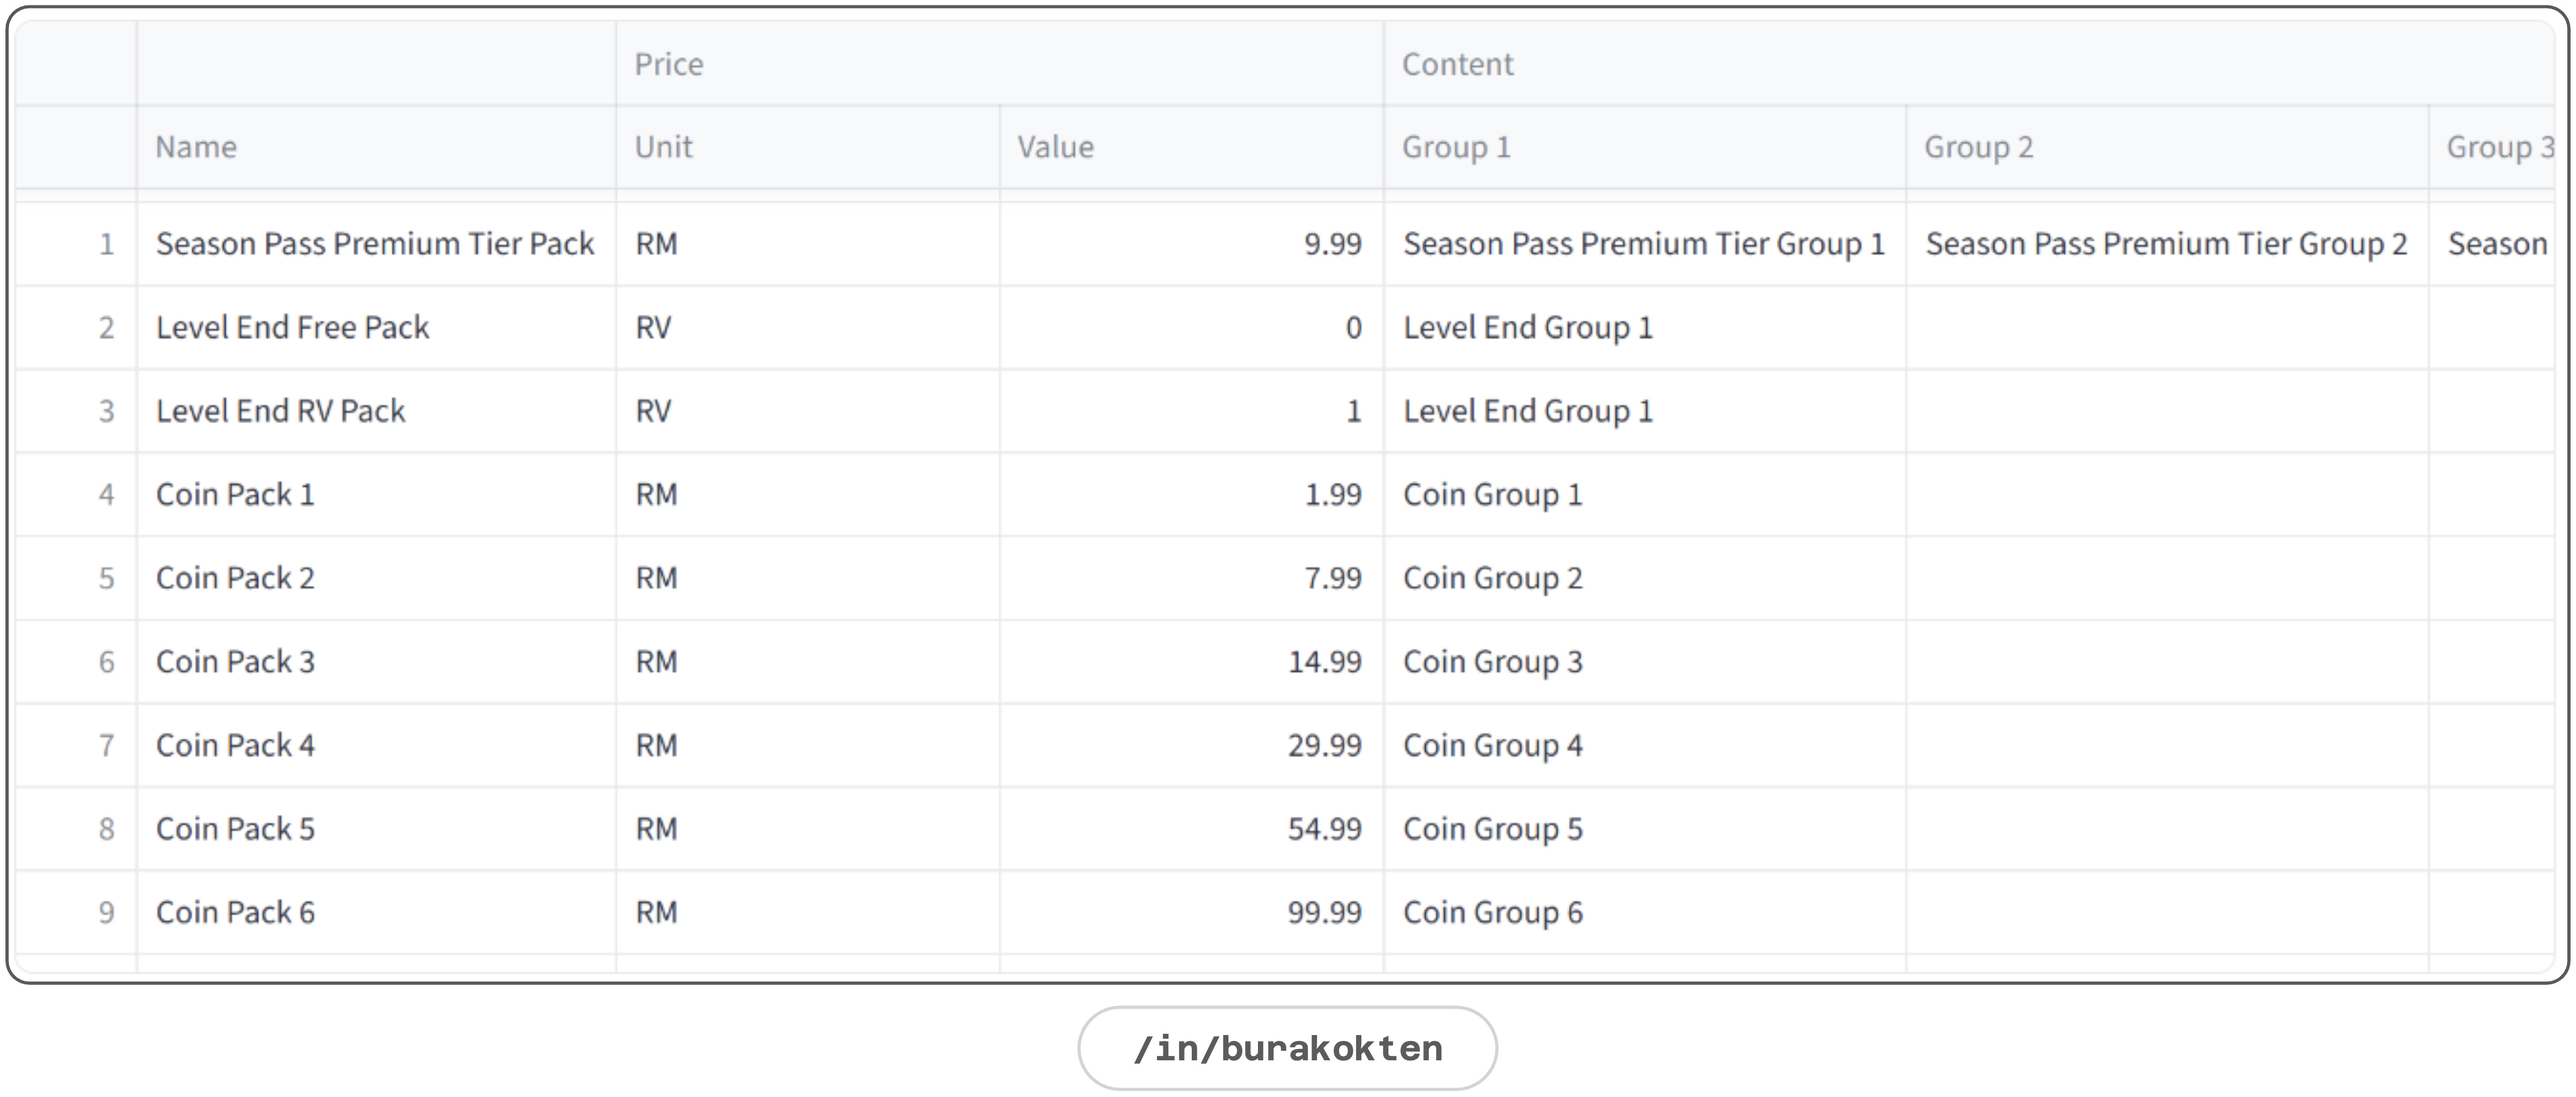
Pack
A pack is a ready-to-purchase combination of groups.
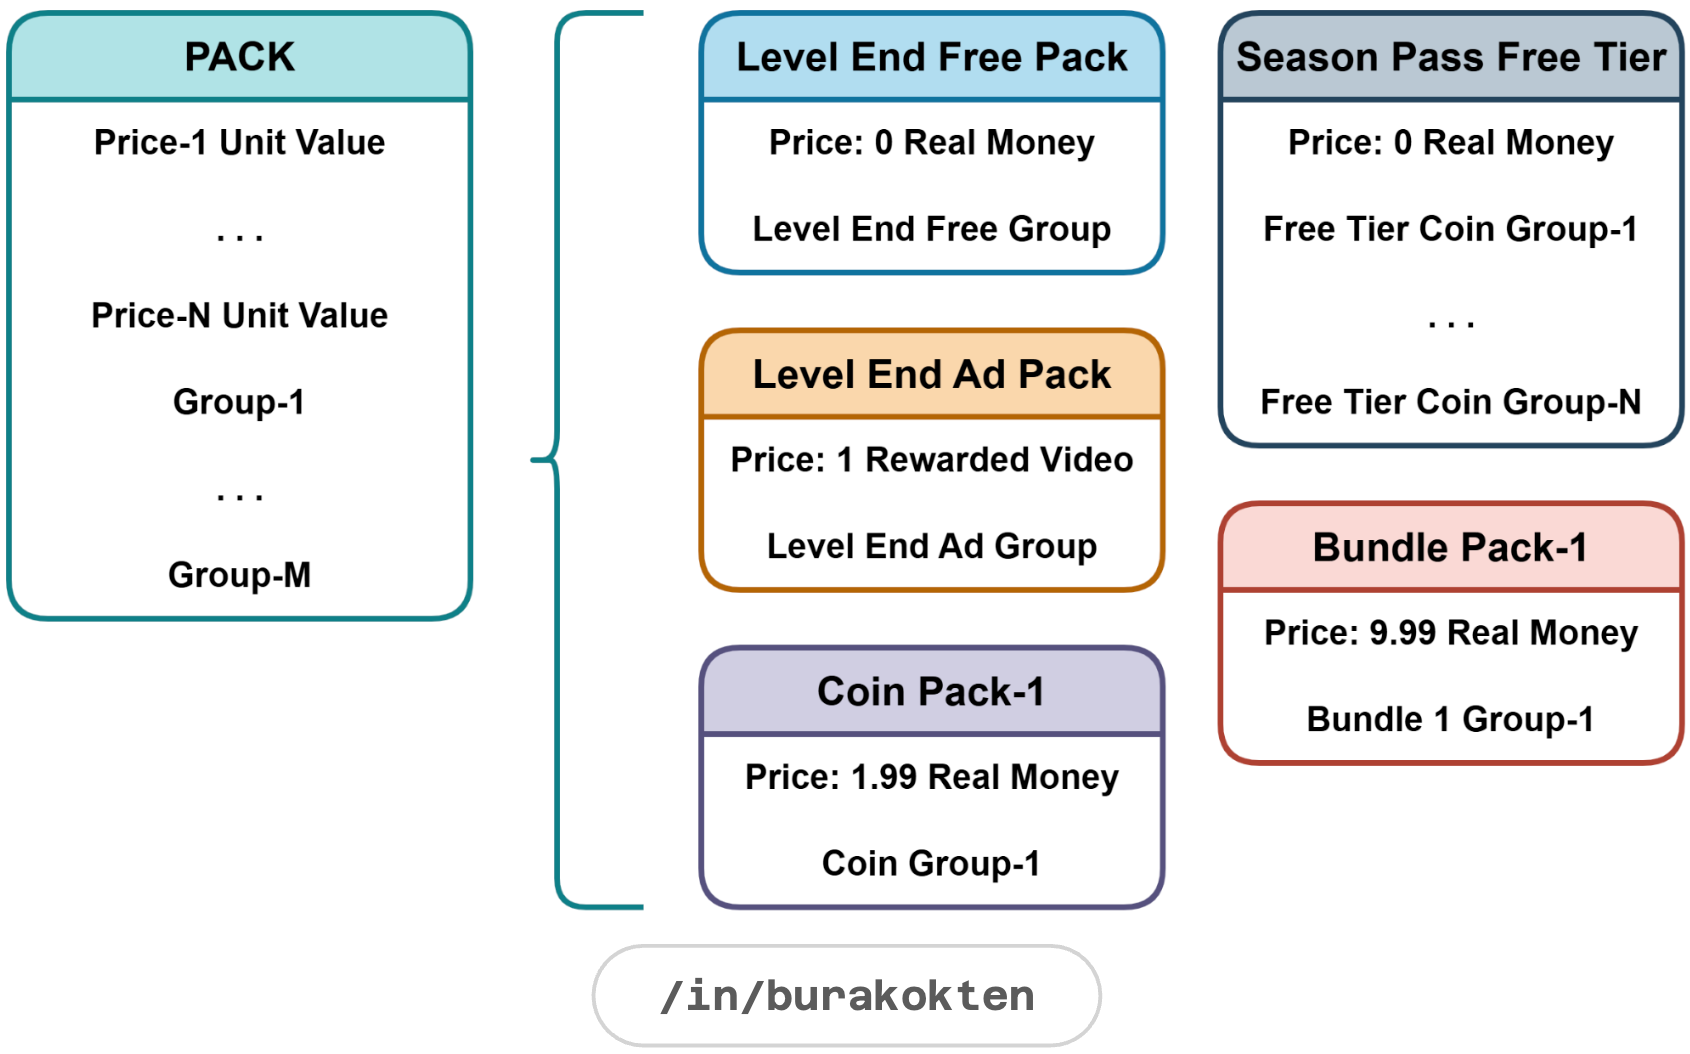
Packs can function both as shop items and as reward items. When a pack is used as a feature reward, its contents are managed by that feature.
e.g. Progression-based event rewards.A demonstration of the Packs module is given below:
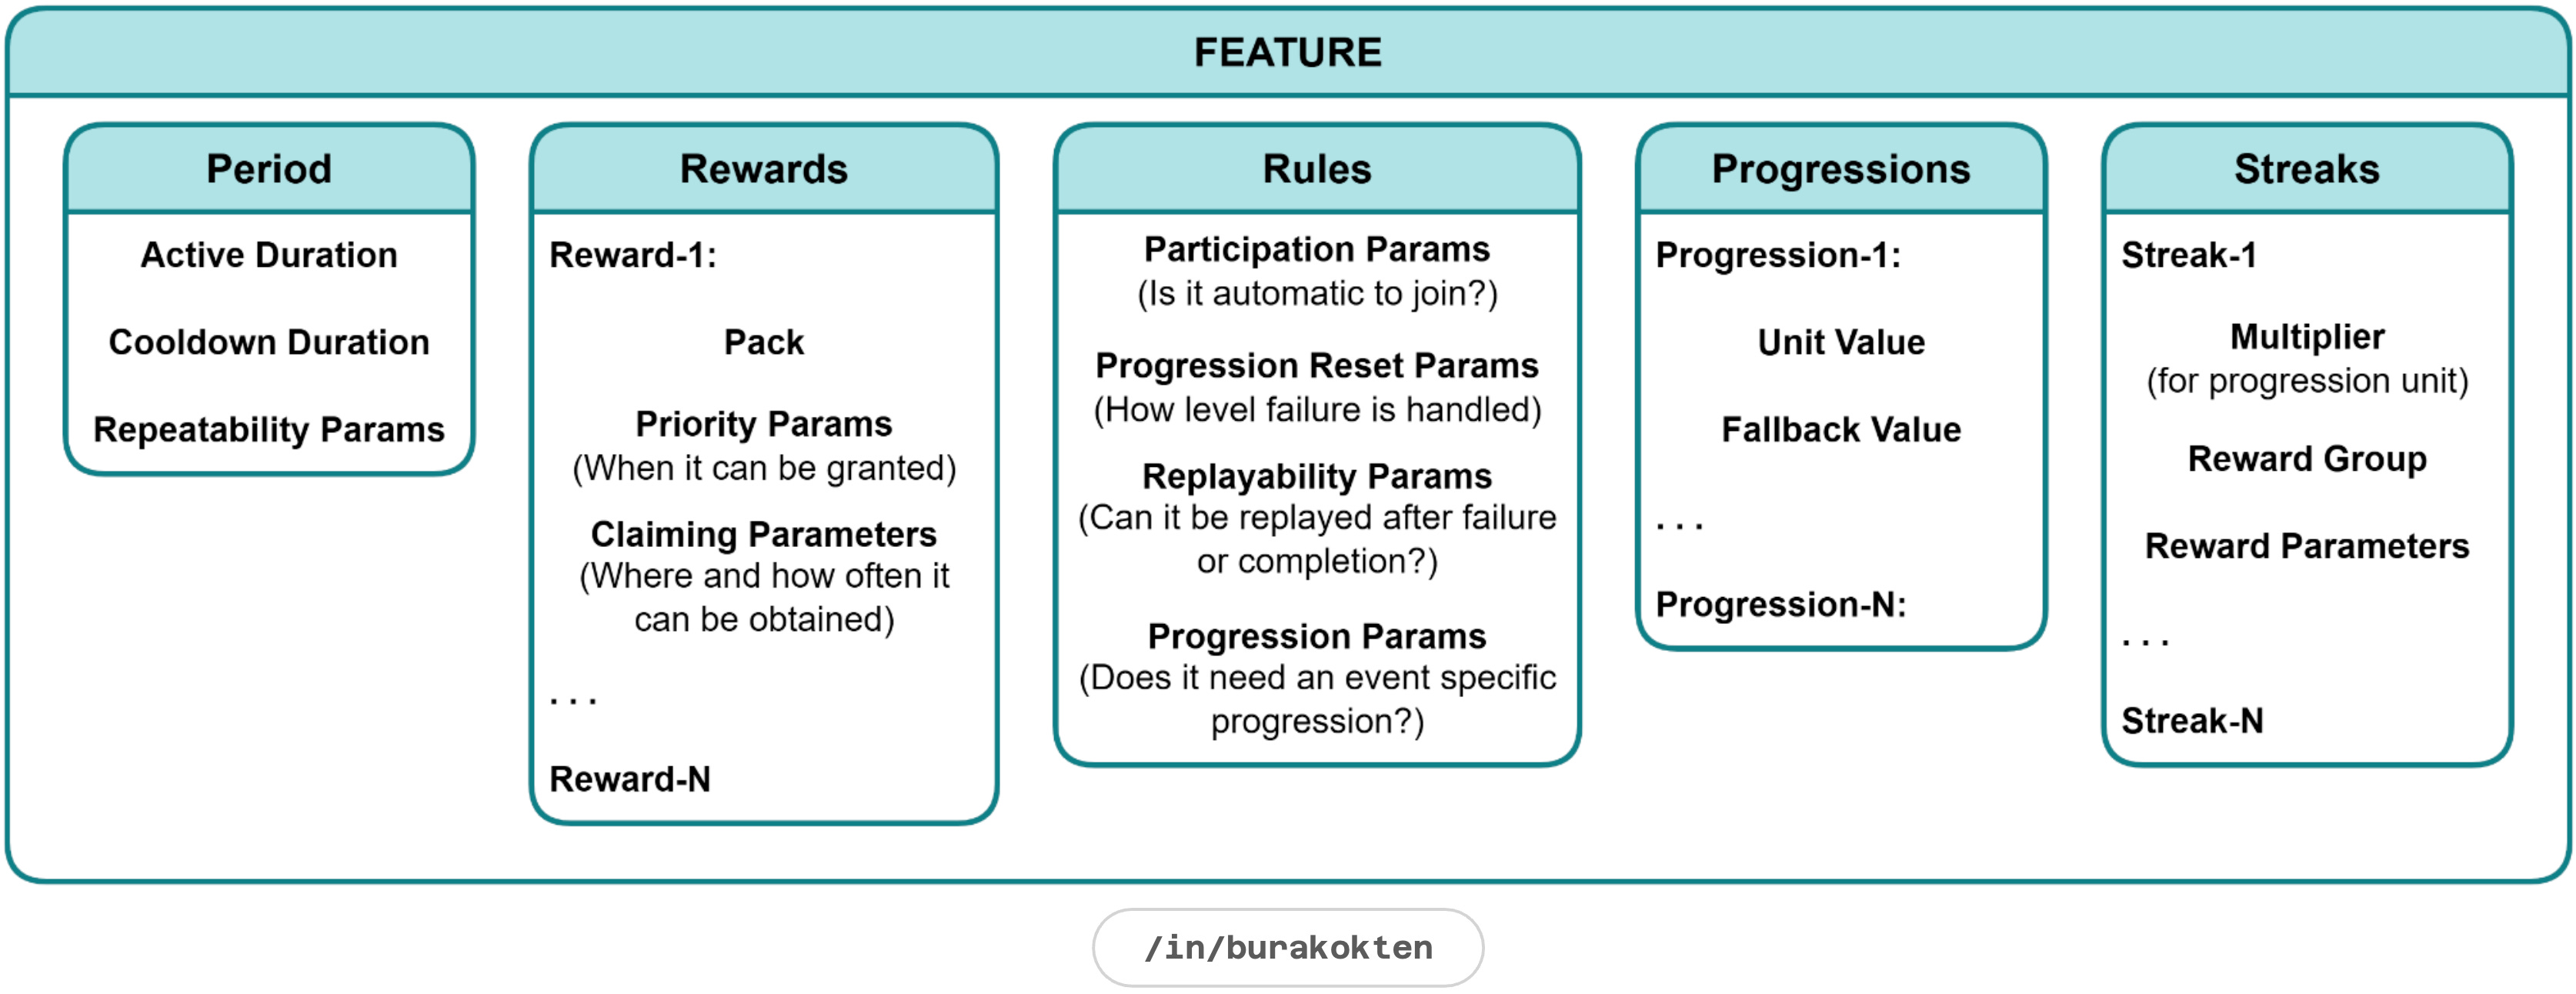
Feature
A feature is a dynamic module for liveops event design. Although many different sub-systems can be attached, I considered 5 main systems:
Period
Rewards
Rules
Progressions
Streaks
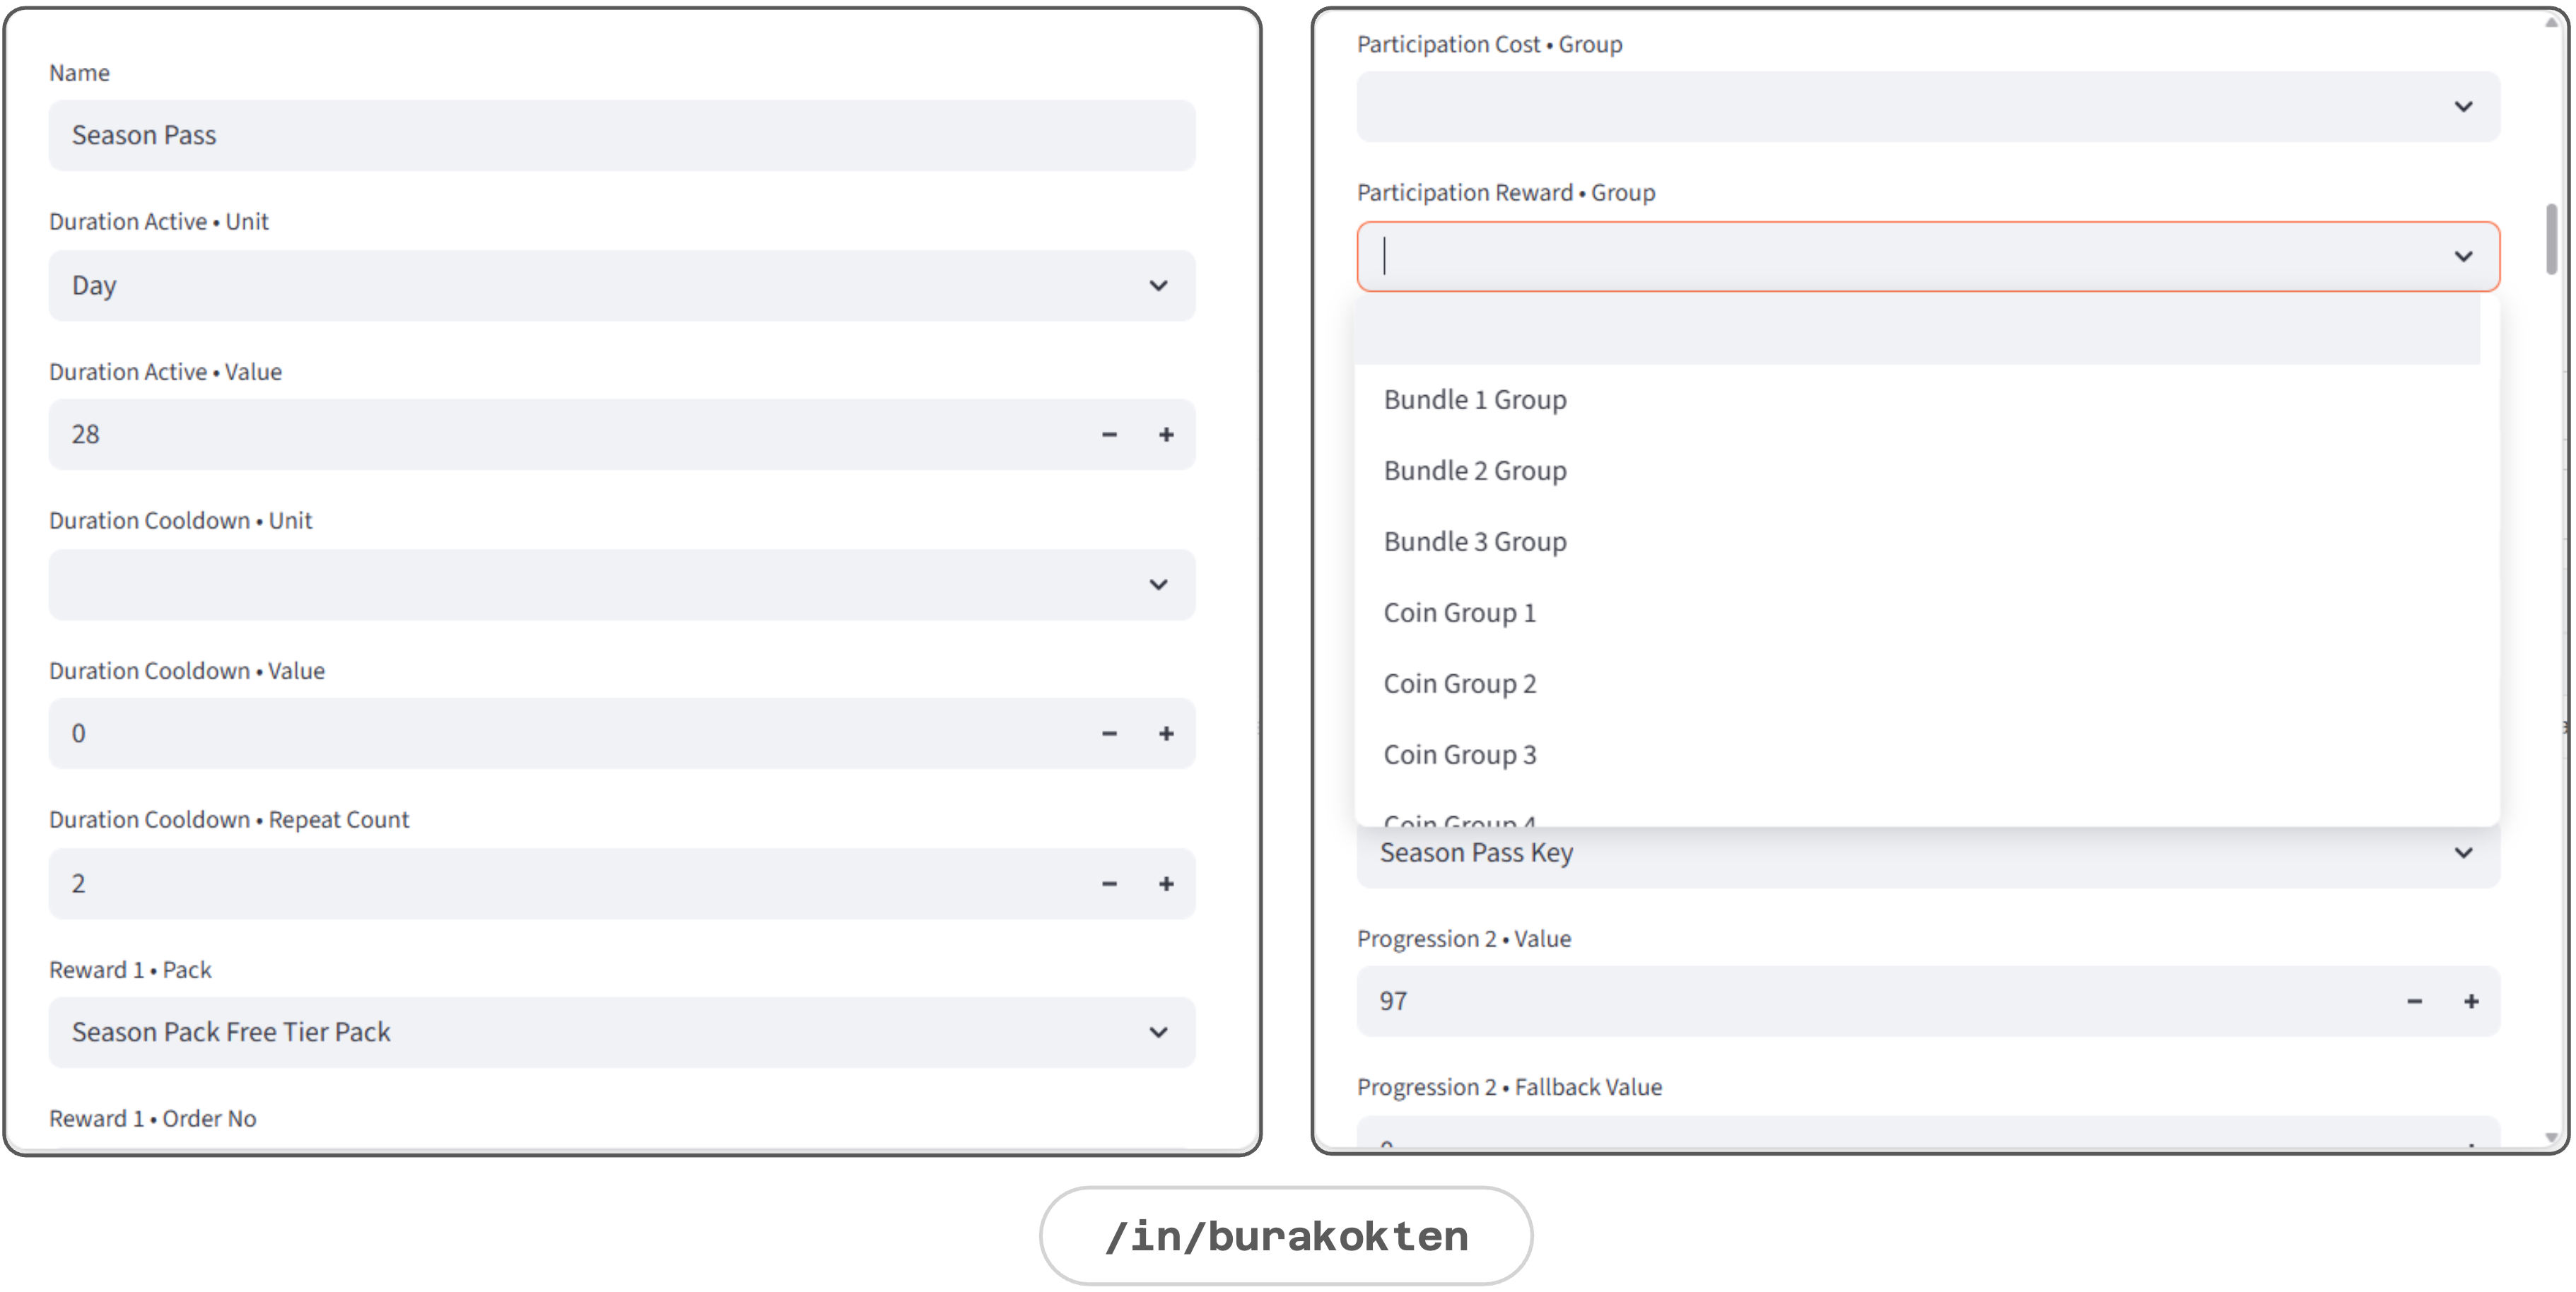
It can be designed in any form from Piggy Bank to Battle Pass Plan, from Streak Rewards to Collection Events.

A feature can be modeled to analyse how the game economy reacts to changes in the parameters of a potential event. One event can be a combination of multiple sub-events so that each part can be tested separately.
A demonstration of the Features module is given below:
Resource Flow > Units
A resource flow system defines how modules are activated throughout the levels.
Units section in the resource flow is responsible for distributing feature-specific resources, as well as constant amounts of resources that are guaranteed to be gathered or spent per level.
It is also useful for answering questions such as, “How does the resource balance change if we add X amount of coins at level 120?” without touching any module.
The probability of any resource distribution can be defined directly here if the proxy design is not introduced into the system.
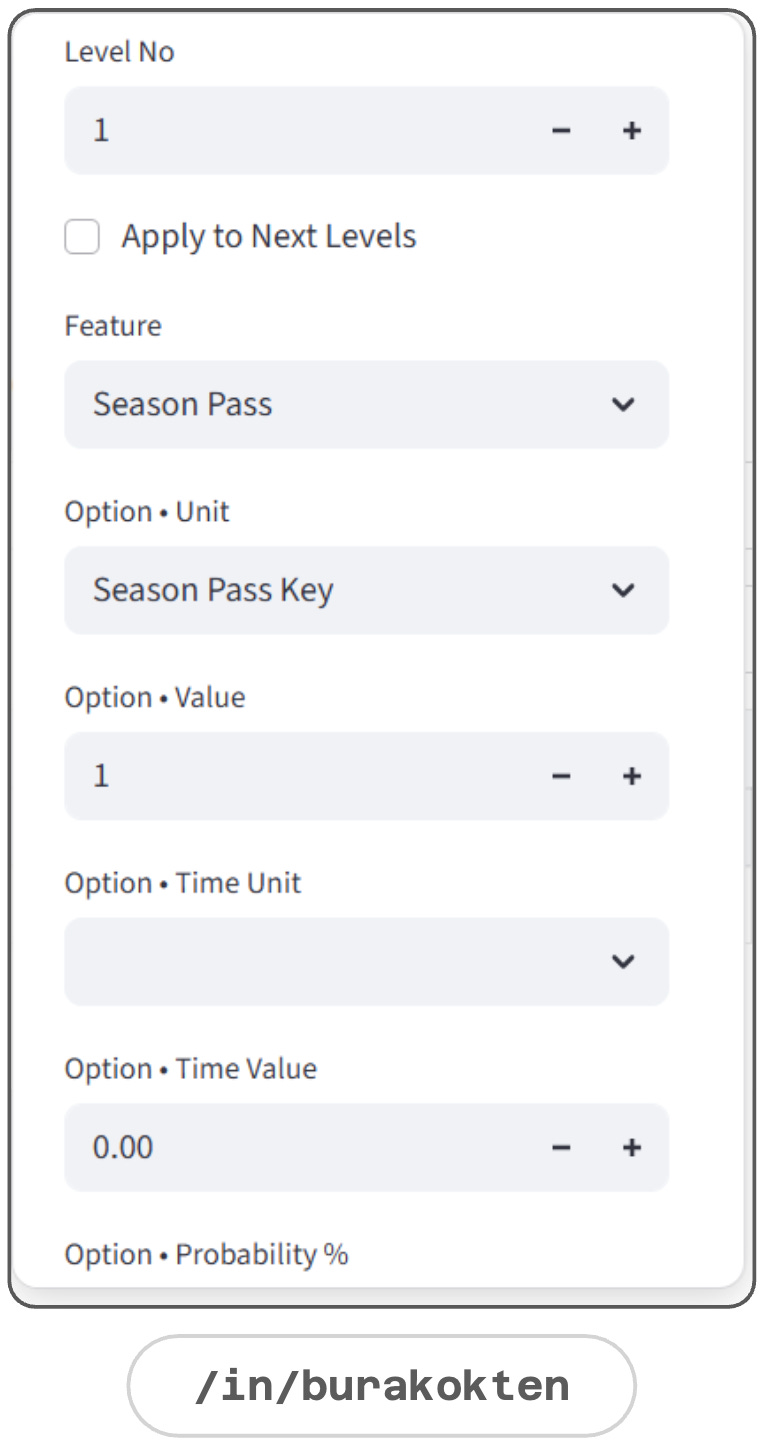
In the image given below, a collectible key is introduced into the system and triggered when the event is active.
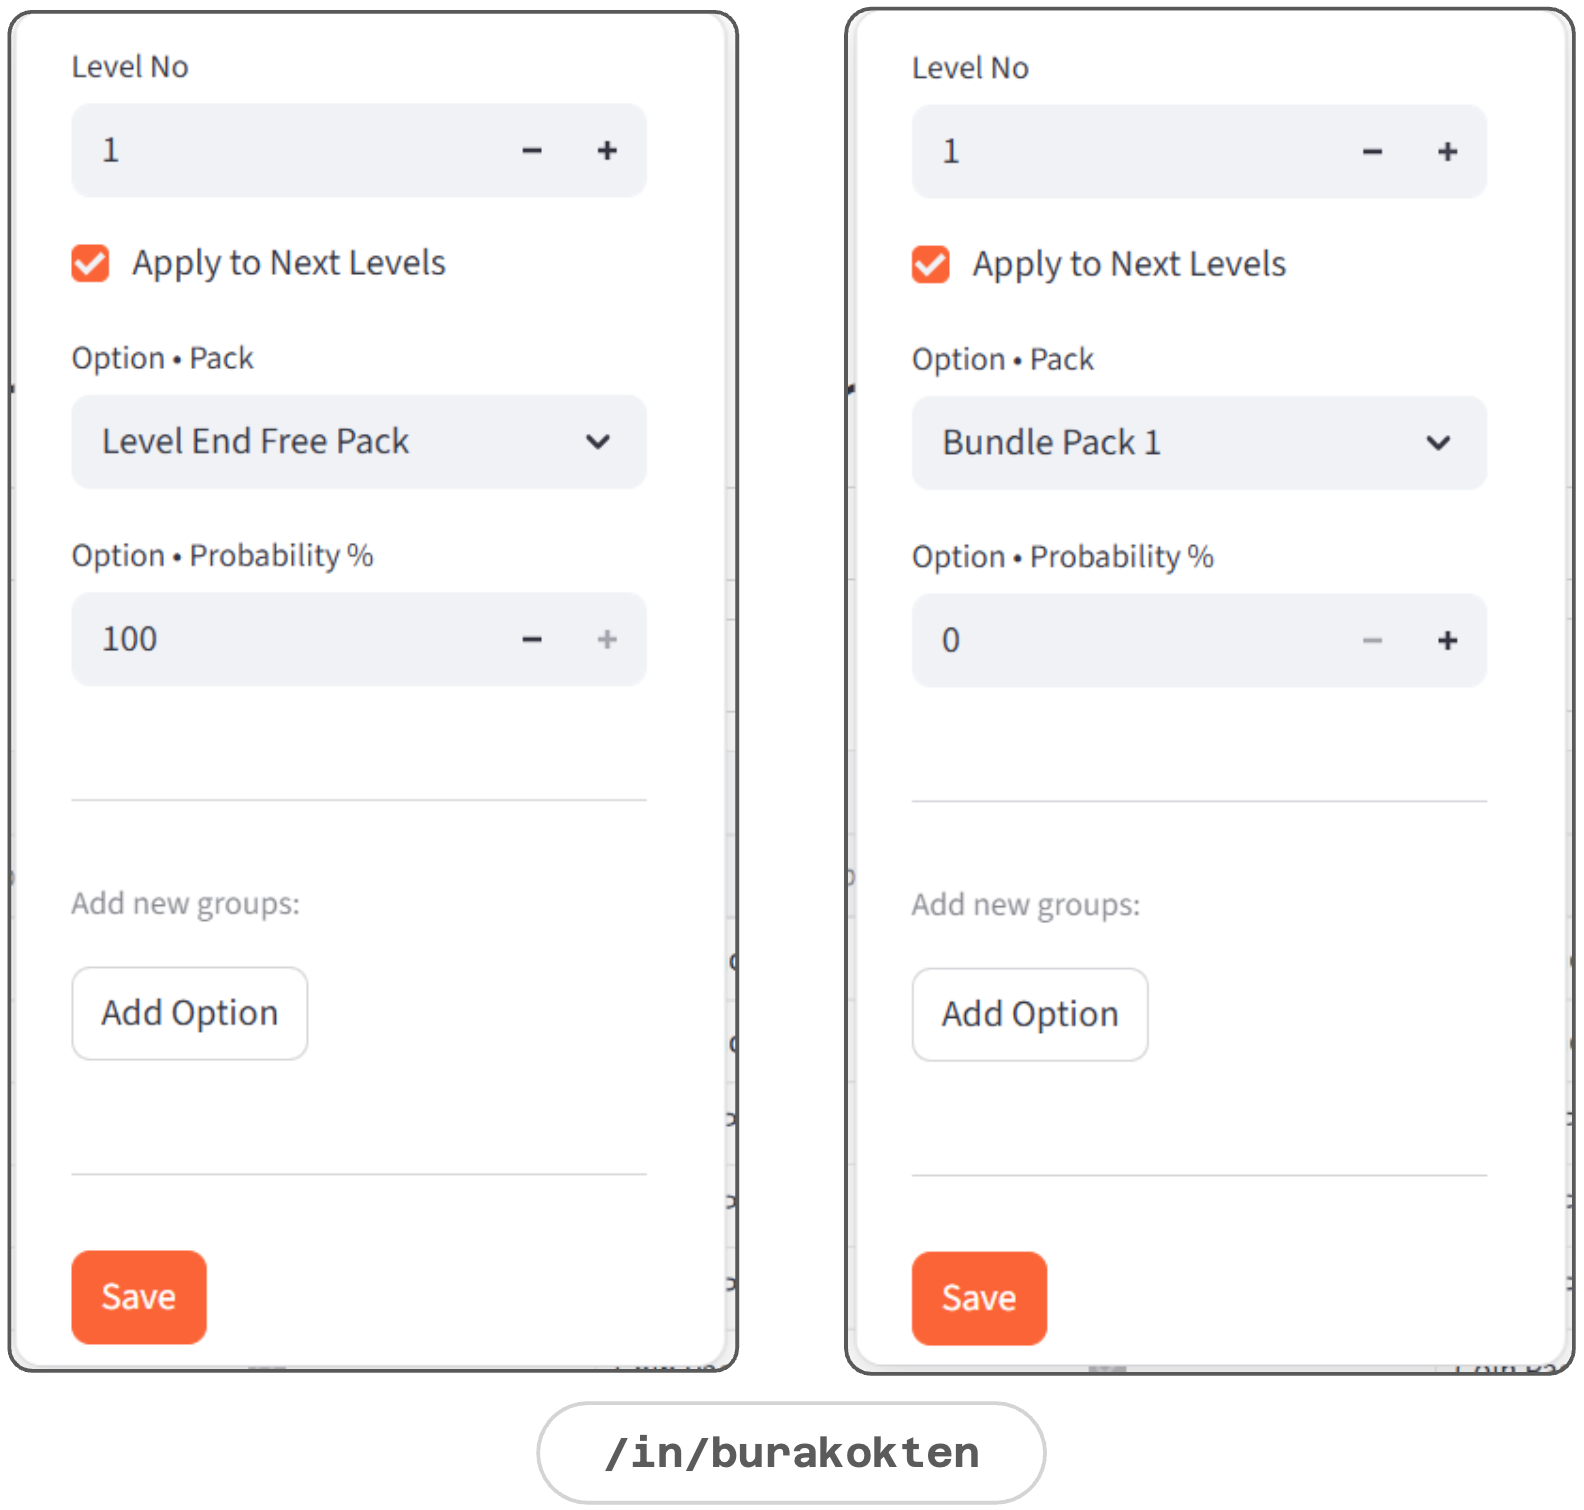
Resource Flow > Packs
Packs are introduced through the resource flow to define the levels at which they are available for purchase. They’re based on rewarded videos, such as level-end ad rewards, are also introduced here.
The probability of purchasing a non-free pack depends on the purchasing rules defined in the proxy design.
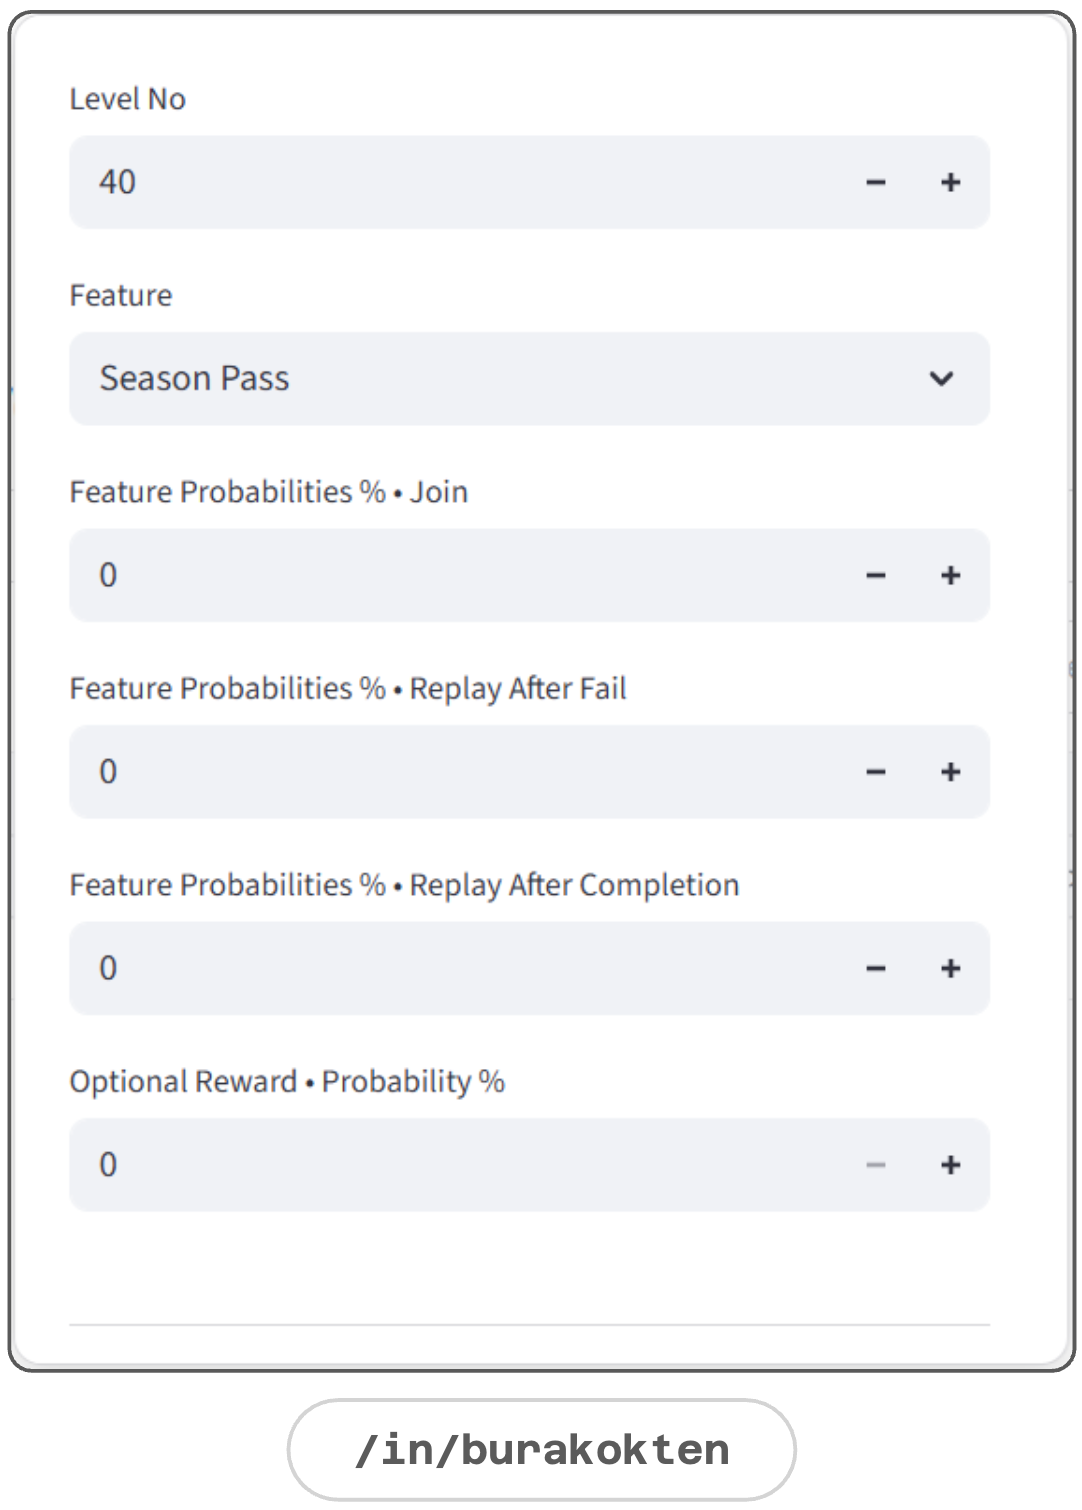
Resource Flow > Features
Features in the resource flow define at which level an event is triggered, but they do not determine how the event is executed, as that is a feature-specific configuration.
Event joining, replaying, and reward-obtaining probabilities can be defined as constants if no proxy rule is provided.
Resource Flow > Equivalents
As first shown in the Unit section, each unit can have an equivalent. However, this equivalence can change when new packs, events, resources, etc. are introduced into the system.
Equivalents section in the resource flow handles these changes when a new equivalency is defined.
e.g. Introducing a new event increases level completion per session +3. This can either be an assumption or derived from real data:
Old -> Session = 5 Levels
New -> Session = 8 Levels starting from level 40.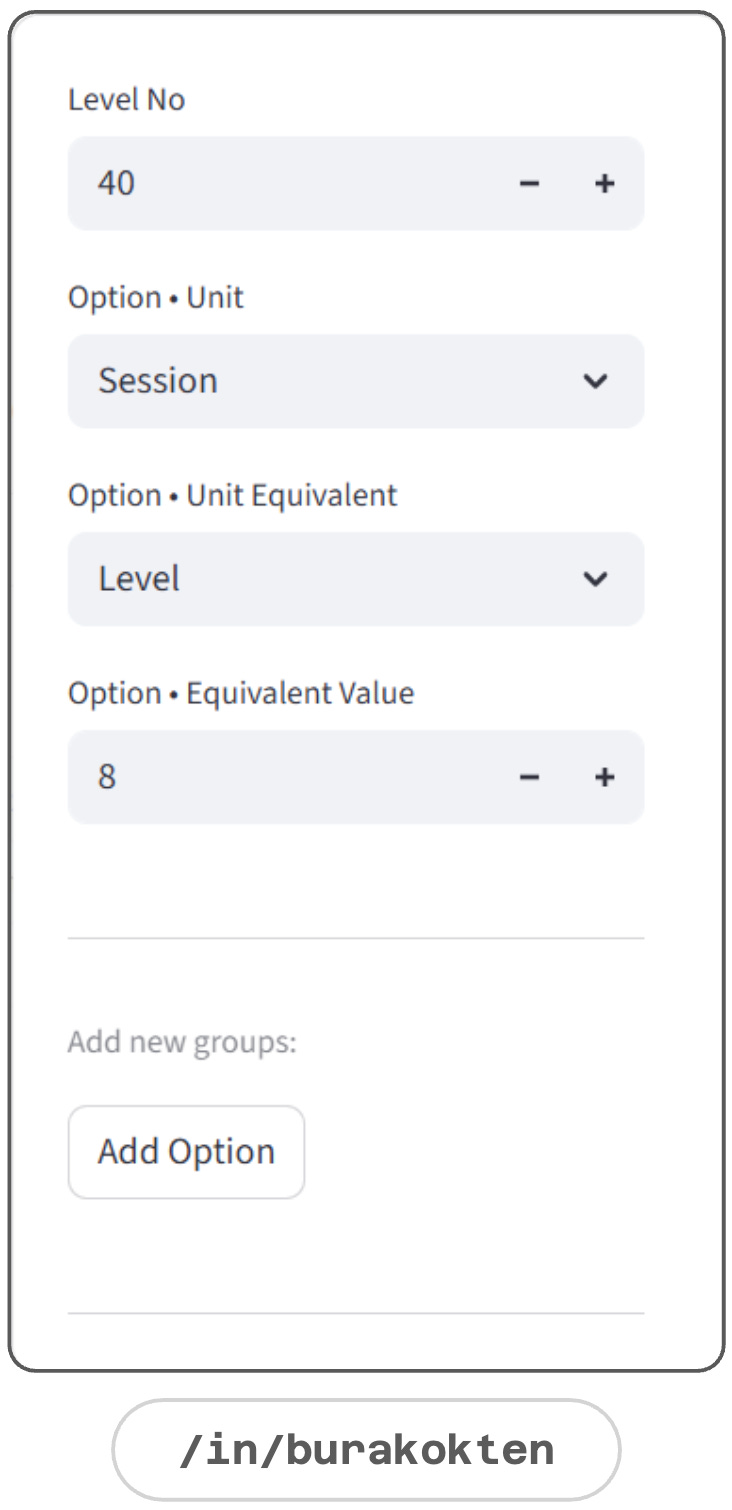
Proxy Design
In this section, I group all formal models under proxy design. This makes it possible to manage the models from a single central structure.
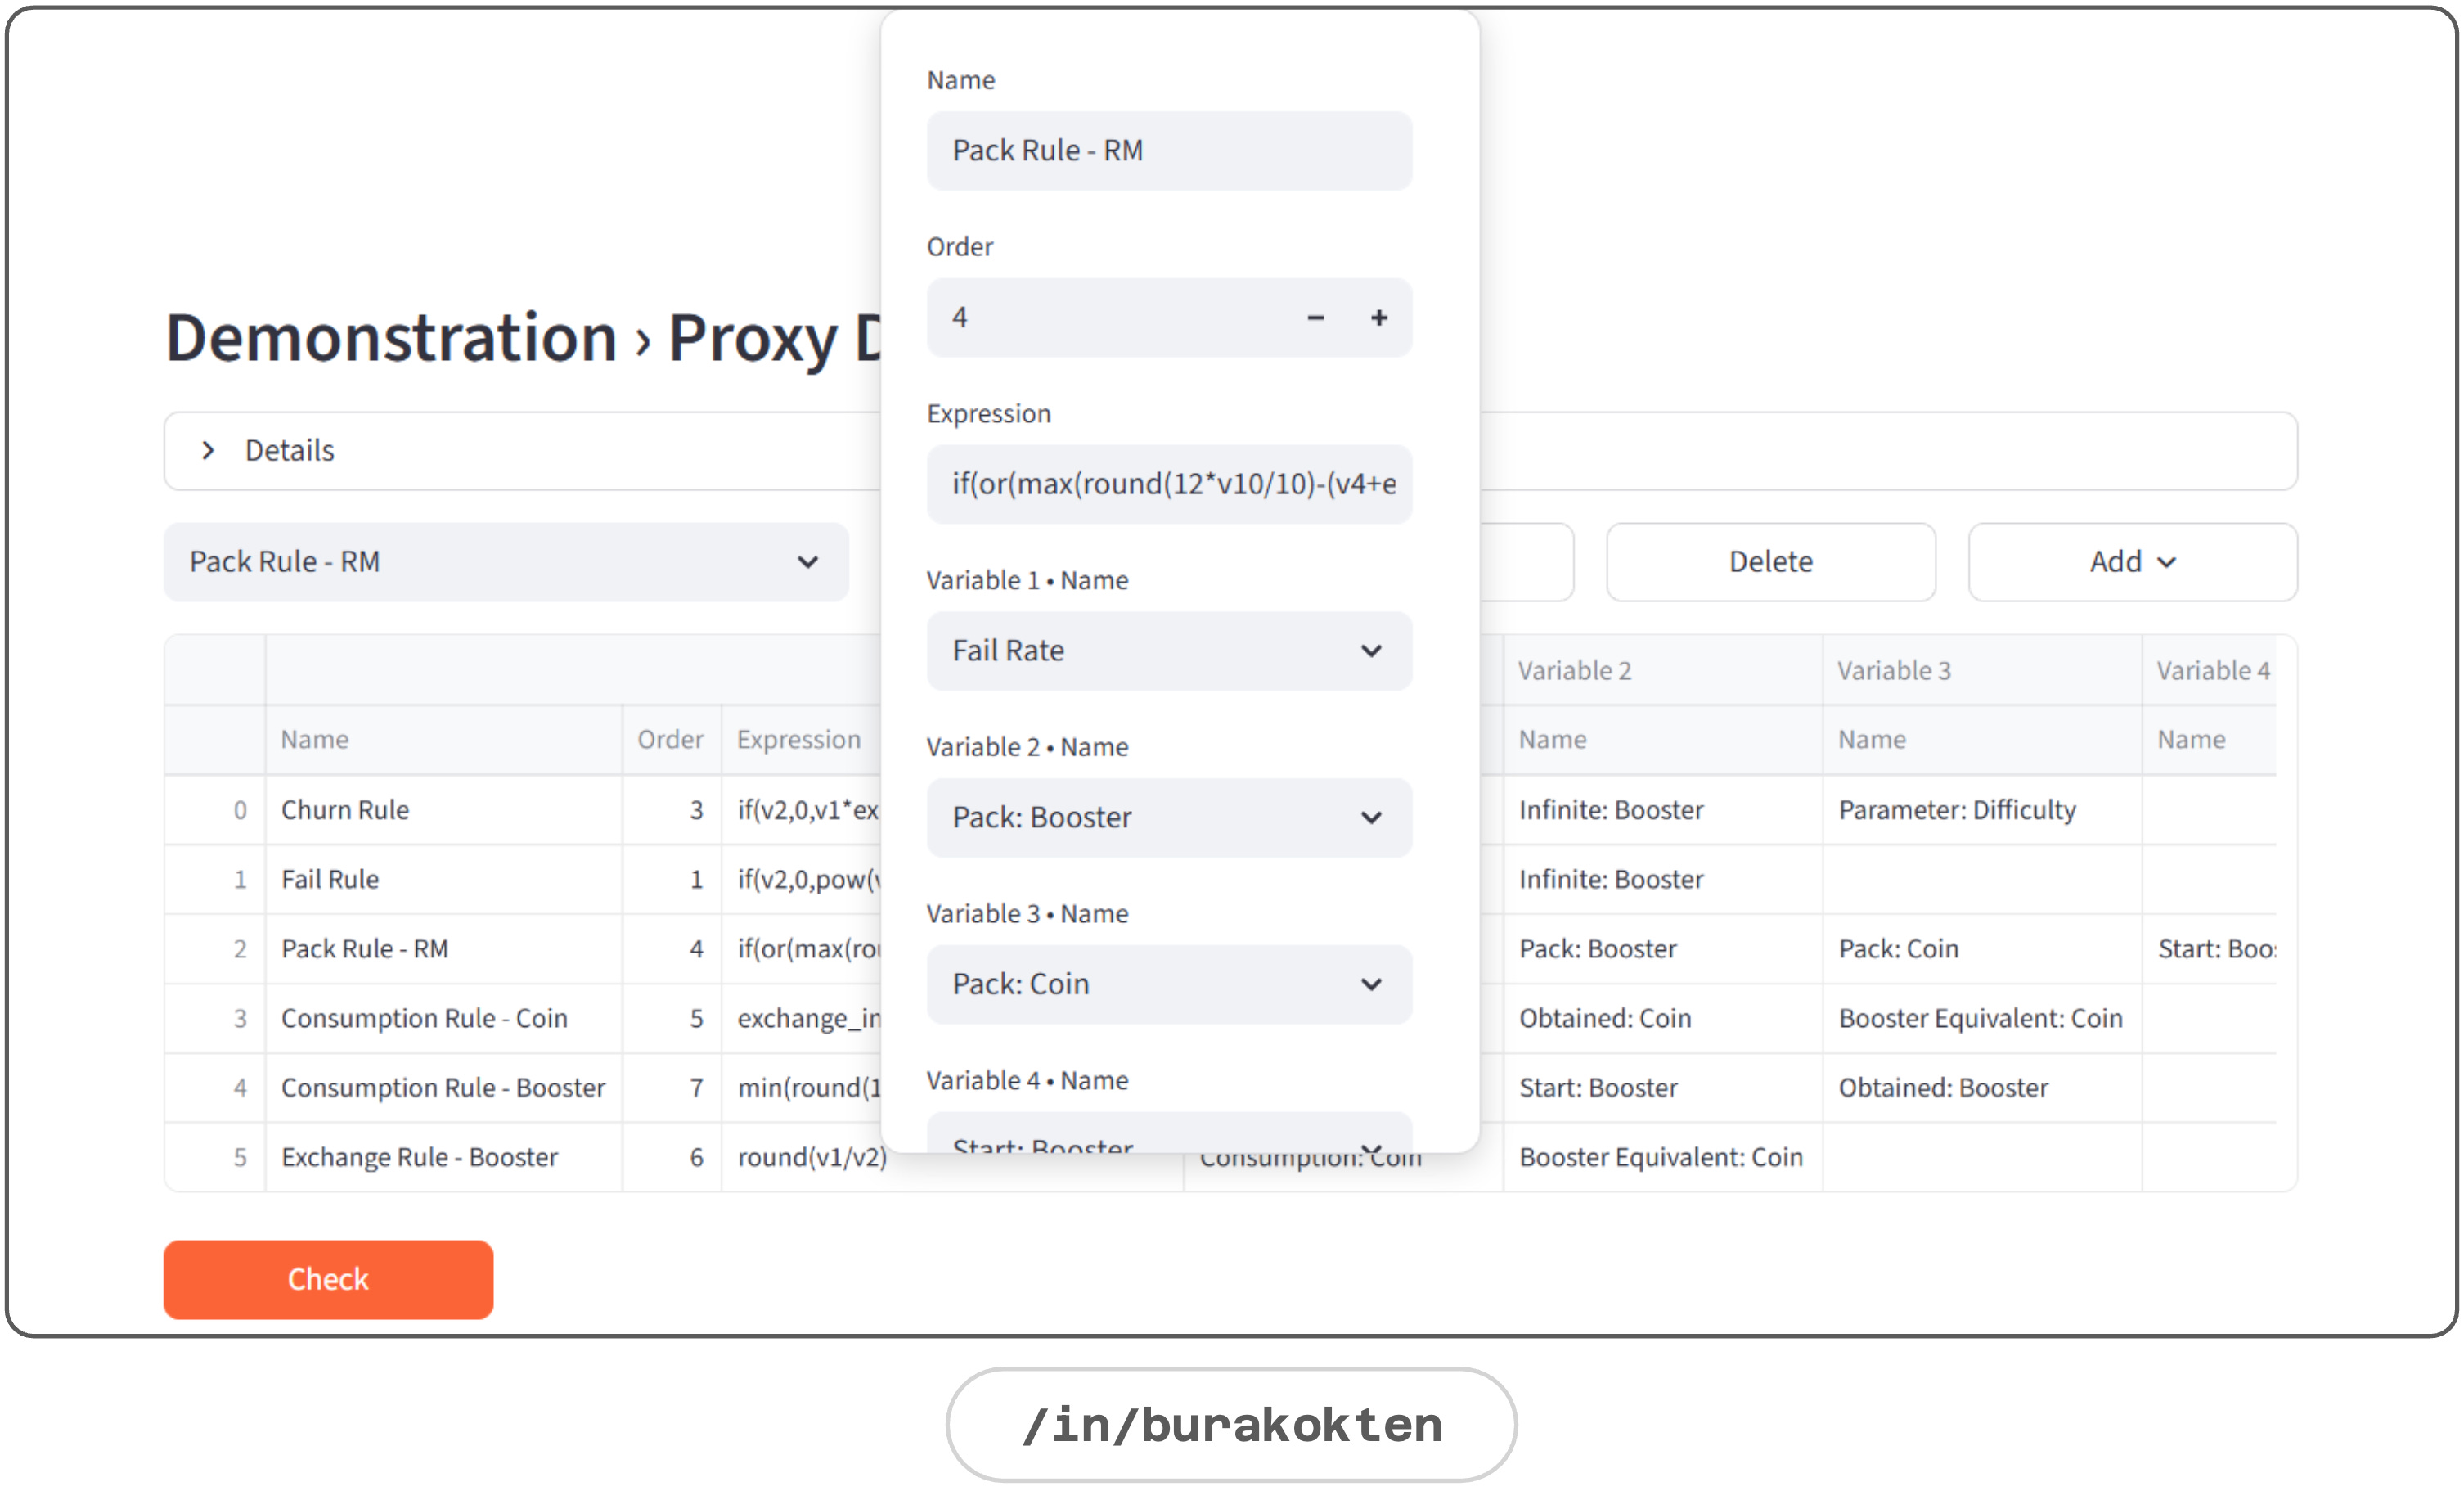
Proxy Design module runs 5 major mathematical models designed to simulate player behavior based on either hypotheses or insights derived from analysis of real player data:
Churn Rule (how close a player is to abandoning the level)
Fail Rule (how close a player is to failing a level)
Pack Rules (when a player tends to make an IAP or watch a rewarded video)
Consumption Rules (e.g. when a player tends to use a booster)
Exchange Rules (e.g. when a player tends to exchange coins for a booster)
These models are game-specific and therefore require separate modeling for each game. In either case, it grounds abstract ideas so the models can be easily improved or completely changed, while also creating coherence between them.
Apart from regular math expressions, supporting custom expressions also increases the depth of the proxy models. Here are some examples:
stsigmoid (stochastic sigmoid)
An s‑shaped decision curve that blends a base chance with a ratio and adds mild randomness.
e.g. More booster uses barely reduce failure at first, then sharply improve success after a threshold, before the effect stabilizes.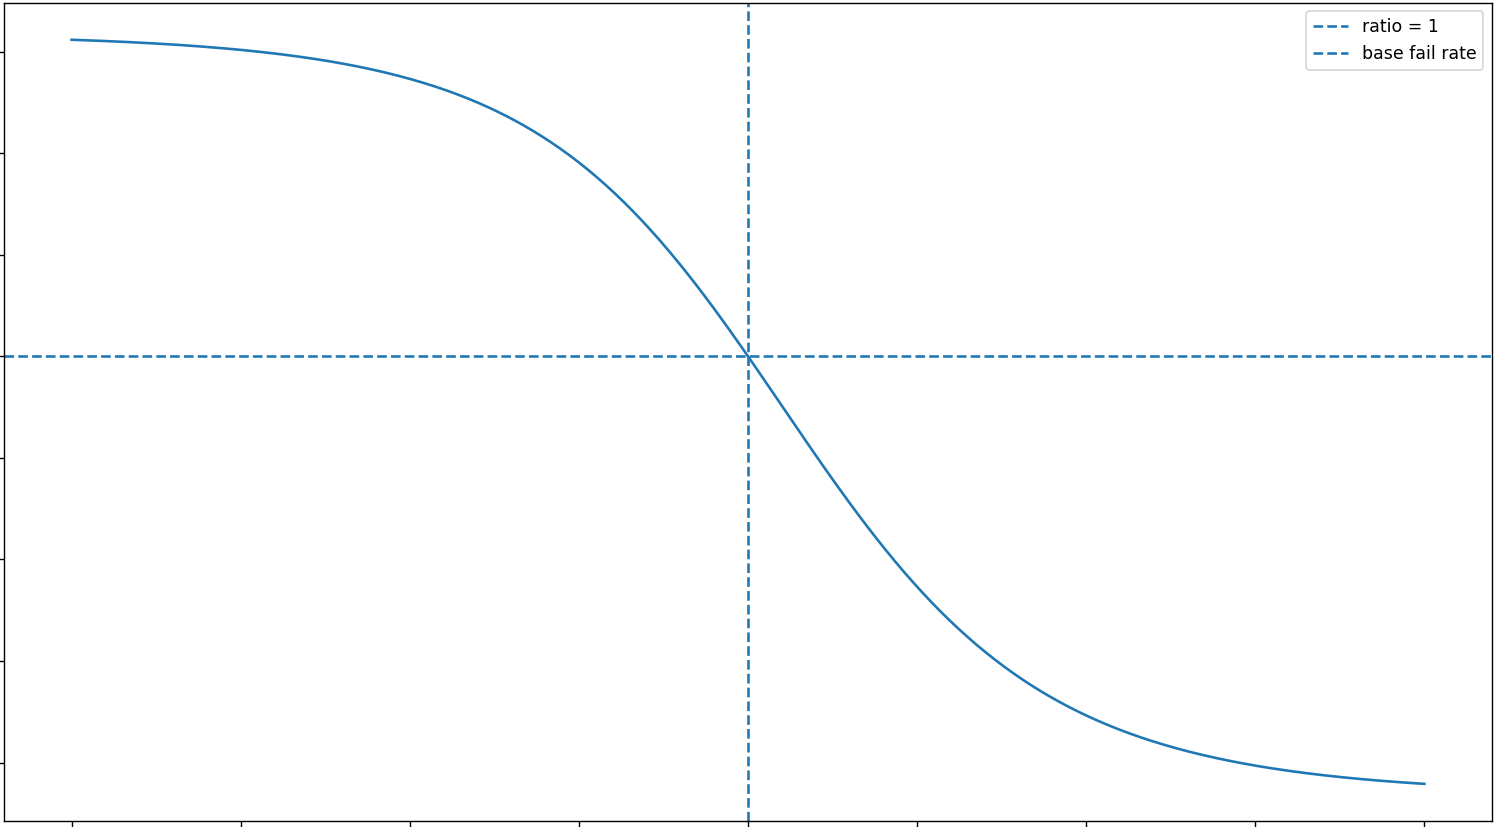
stgauss_score (stochastic gauss score)
A bell‑shaped score centered at a target value that falls off with distance from the target and adds mild randomness.
e.g. At a given level, as difficulty rises, the IAP probability climbs up to a peak, then declines beyond that point.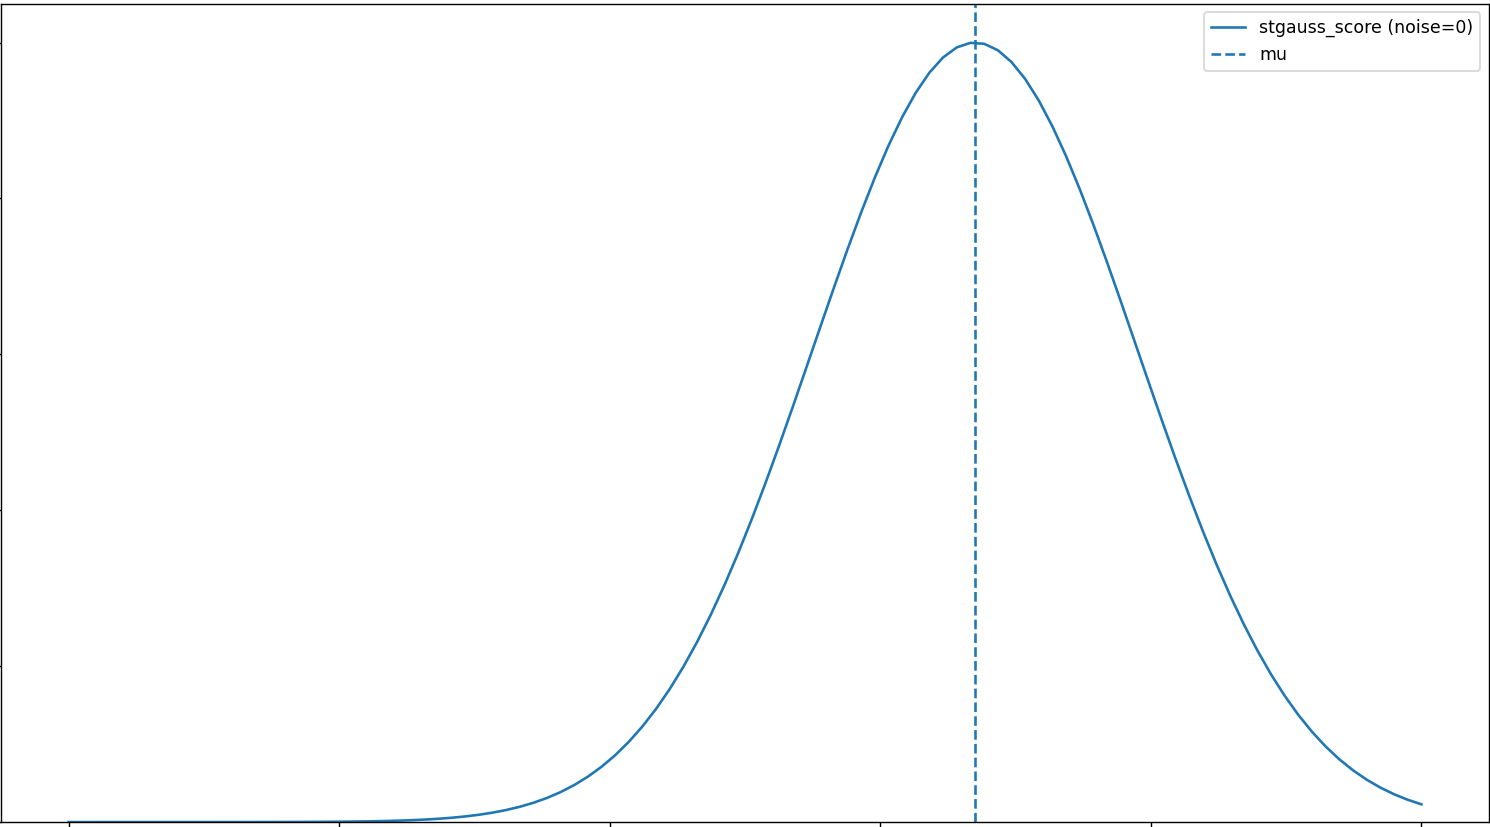
ema (exponential moving average)
A moving average that weights recent values more heavily while still smoothing the overall trend.
e.g. Churn from difficulty may not be just about one level as players react to recent difficulty trends, so using an ema helps capture that behavior.mmin, mmax (moving minimum and maximum)
The lowest and highest values seen over the last n points in a series.
ref (reference value)
The value of a variable from player data for comparison inside a formula.
exchange
It converts a value into a target unit using the configured unit equivalences.
And that’s it!
Although this is a much broader topic than what can be fully covered in a single blog post, I tried to explain the key concepts as clearly as I could.
Thinking in systems can be demanding, but it is crucial for understanding how decision mechanisms evolve through cause and effect, not only in game systems but in everything we touch in life.
It was a pleasure to write this post, and I hope you enjoyed reading it as well.
See you in the next one!