
Designing Tripeaks Solitaire Levels with Predictable Outcomes
Can theoretical approaches provide enough insights into how difficult a level is?


In this article, you will discover why we need and how we can design a properly constructed level generation algorithm, supported by theoretical calculations and compared with Monte Carlo simulations.
What you won’t find is a complete procedural level generation system, as I don’t show how to generate level layouts. That can be the subject of another post.
Keep in mind that without the involvement of a level designer, levels would be completely soulless. Therefore, the system I describe in the post is not a replacement for a designer, but a supportive tool for them.
I selected tripeaks solitaire for this post, as it is a trending genre for a while. Although this is a highly technical article, I did my best to smooth out the sections and add gameplay videos as much as possible.
There are 4 main topics throughout the article:
Basics of casual Tripeaks Solitaire, discussed in the Introduction section.
Theoretical aspects, discussed in the Key Considerations section.
How to generate ranks, discussed in the Auto-Rank Generation Algorithm section.
Player model, simulations and their results, discussed in the Monte Carlo Simulations section.
Additionally, I specifically added a simple obstacle mechanic to show how it can affect the gameplay, as well as the effect of the average number of open cards, which is also an important concept in level design.
In the upcoming articles, I will also discuss live event modeling and how to create a balanced game economy around it. So I would recommend subscribing if you haven’t already.
Introduction
Before exploring the auto-level generation concepts, it is good practice to review the game elements. Although I covered a broader version in the Candy Crush Solitaire Deconstruction and Experimenting with Auto-Level Generation article, we will specifically focus on the parts relevant to this article.
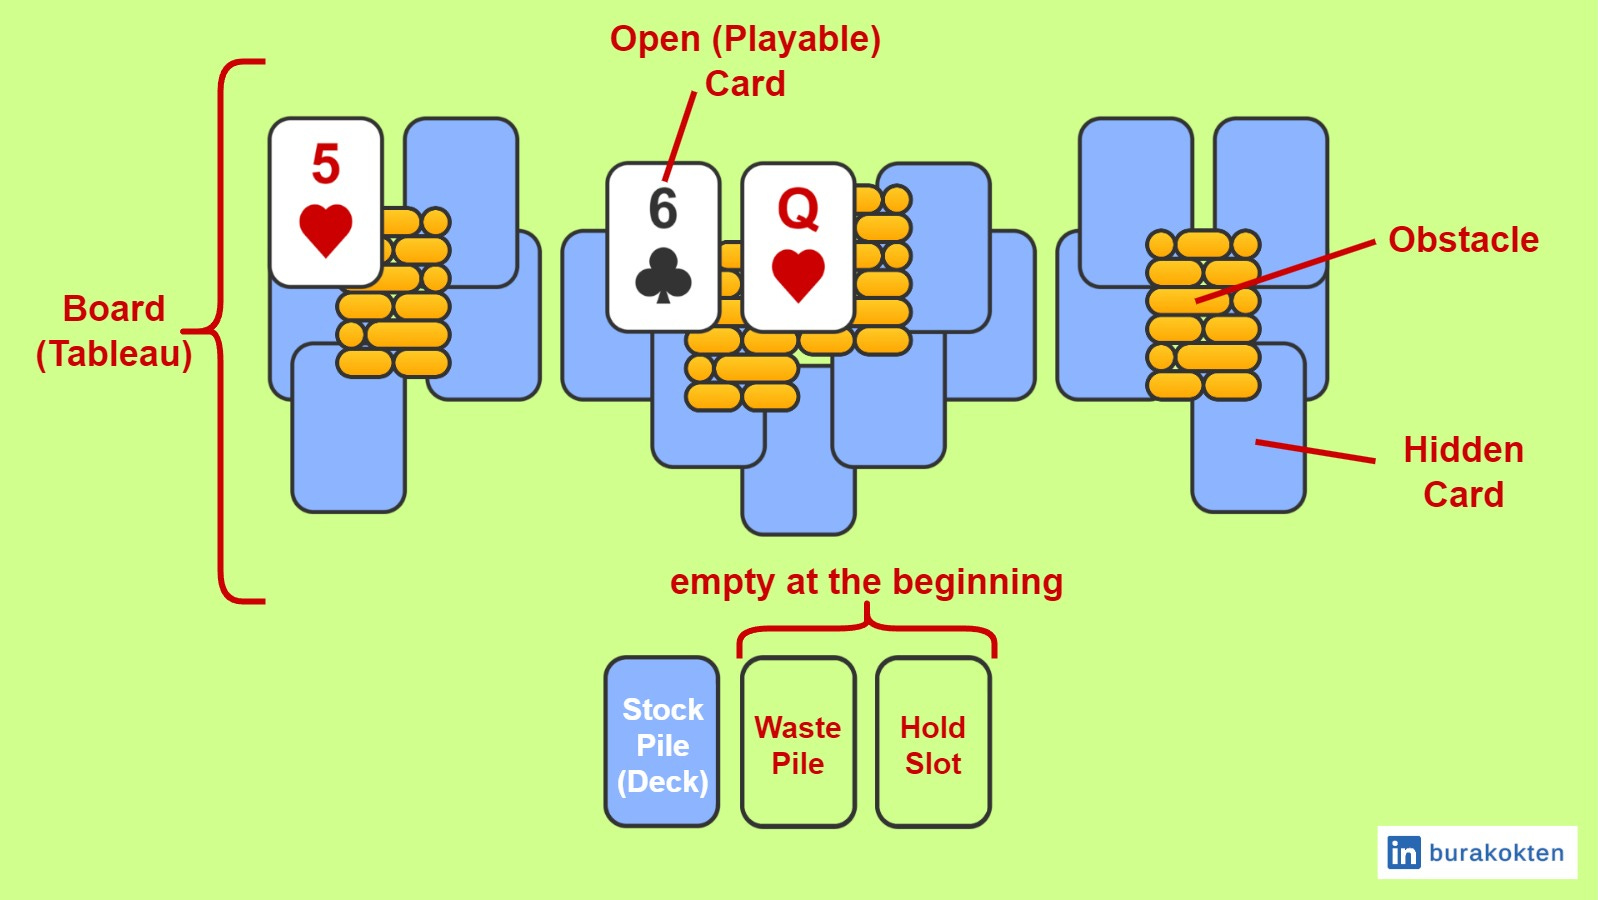
In a casual tripeaks solitaire game, the goal is generally to clear the entire board (tableau) of cards, unless the objective is to collect specific items, create desired streaks or achieve a predefined score etc. Players try to match the top waste pile card with board cards that are either one rank lower or one rank higher. Card ranks are cyclic, meaning the first and last values are also considered neighbors. Although a standard deck consists of 52 cards and 4 suits (hearts, diamonds, clubs, and spades), it is not mandatory to stick to these numbers. Card generation can be handled dynamically based on the situation.
The board consists of open (playable) and hidden cards, as well as obstacles that prevent cards from being revealed. The stockpile (deck) is used when the top card of the waste pile does not match any of the board cards. The hold slot is a unique mechanic introduced in Candy Crush Solitaire, however, I included it because it is a cool feature. Players can set aside the first card from the waste pile into the hold slot to create more consecutive matches. It is completely optional to use.
Key Considerations
In this section, I will cover some important concepts. If you have read the auto-level generation section of the Candy Crush Solitaire Deconstruction and Experimenting with Auto-Level Generation article before, you may skip some parts. However, I recommend reading all of them, as they provide deeper explanations of the auto-level generation approach and how I evolved the system.
1. Group-Based Randomization
Unlike a pure probabilistic approach, constrained randomization guarantees that an event will occur within a given closed space while keeping the occurrences random within the given space boundaries.
Assume you have 10 cards, each with a 10% chance of being a matching card. In a non-deterministic approach, there is no guarantee that you will find a match even if you draw all the cards, nor is there a guarantee that you will have only one match. On the other hand, constrained randomization ensures that exactly one card will be a match while keeping its position random.
In the previous article, I showed that we can manage the number of matches between board cards by using constrained randomization to create consecutive chains. For example, we can set up a configuration consisting of 5 cards, where only 2 matches will occur. In this scenario, the following possibilities become available (M: matching card, U: unmatching card and 2 matching cards create 1 match):
[M-M U M-M] e.g. [2, 3, 5, 6, 7] and total matches = 2
[M-M-M-M U] or [U M-M-M-M] e.g. [2, 3, 4, 5, 7] and total matches = 2
The problem is that even though the total number of matches seems equivalent, the longest consecutive matches in the second group are three times those in the first one. Moreover, we cannot guarantee the longest or shortest chains we desire. So, how can we solve this?
The solution comes directly from the group itself. Instead of preparing a configuration with 5 cards in a group and 2 matches, we can represent it with 3 different blocks, in total, with 2 matches, and this can be in any form:
[M-M] [U] [M-M]
[U] [M-M] [M-M]
[M-M] [M-M] [U]
The biggest difference is that any two blocks must now have ranks that do not match anymore:
✅ [2, 3], [10], [5, 6] → none of the groups are matching with each other.
❌ [2, 3], [10], [4, 5] → first and last groups form a consecutive match.
Then, we shuffle the groups. This way, the result remains randomized, but with more control over the outcome. We will dive into the details of the algorithm in the later sections. However, if you want to see how it works visually, watch the video below.
3 repeating groups are defined with sizes 3, 2 and 1 respectively. I didn't apply the shuffling so you can track the cards based on their groups:
START → [A, 2, 3], [8, 9]
[A, 2, 3], [8, 9] → [A, 2, 3], [6]
[A, 2, 3], [6] → [6], [J, Q, J], [4, 3], [8]
[6], [J, Q, J], [4, 3], [8] → [6], [J, Q, J], [4, 3]
[6], [J, Q, J], [4, 3] → [J, Q, J], [4, 3], [8 _ _]
[J, Q, J], [4, 3], [8 _ _] → [J, Q, J], [8 _ _]
[J, Q, J], [8 _ _] → [8 9 8]
[8 9 8] → [2, 3]
[2, 3] → END
2. Variety of Card Ranks
How many unique card ranks can be visible at the same time in a level? How can we manage the difficulty of the level without compromising the fun factor? One of the key considerations we should have an eye on is the use of card rank variety in the algorithm, without alienating player engagement.
When the number of unique cards increases:
It creates a dynamic level from the player's perspective, as it provides more possible and random ways to complete the level.
It becomes harder to manage the level difficulty, because undesired matching conditions become unavoidable with increasing number of open cards.
Look at the following examples. They represent the open cards for 2 different levels. Although the number of required stockpile cards is the same for both in the best case scenario, which one do you think seems more attractive in the overall picture?
[7, 8, 9, 10, J, Q]
[7, 8, 7, 8, 7, 8]
My approach is to minimize the duplication of ranks for any state of the level without sacrificing the level configurations that we will discuss later. Keep in mind that we cannot make all the cards unique, as it would completely eliminate the chance factor. In fact, as we will discuss later, the algorithm will never try to keep all the cards unique.
Any level designer should be informed in real-time by the level tool while designing the level, so they can achieve the desired outcome without spending too much time on trial and error. We all know that it is unavoidable to test the levels before launching them, because we have to ensure how the level feels. However, it is always beneficial to speed up the level design process with automated tools, as we are currently starting to discuss.
Let’s start with calculating average unique cards we can have
where N_avg_unique_cards is the average number of unique cards a group can have and N_groups is the number of groups decided at the beginning. The number 12 comes from subtracting 1 from the total number of unique cards, which is 13 (from A to K).
Let's assume there are, on average, 6 cards open on the board in any state and 3 groups with sizes 2, 1, and 3, respectively. Based on the equation, N_avg_unique_cards becomes 3. This means that, on average, we are allowed to use 3 unique cards per group without breaking the group sizes.
In order to keep it simple, let’s start from A and increase the rank to fill the groups:
If a new card is revealed after each card is collected from the board, and we also continue to collect all group cards in an ideal scenario:
Although I keep it simple in this example, the total number of group sizes is not necessarily equal to the number of average open cards.
Let's look at another example. This time, there are 4 groups with sizes 3, 2, 3, and 4. Again, assume that the number of open cards in any state is equal to the total group sizes. Based on this new configuration, we calculate N_avg_unique_cards as 2.
Initially, we can have a card set like this:
If you didn't notice, the system tries to form the given number of groups without creating any consecutive matches between them, even if there are 12 cards open on average.
For any group, the minimum number of unique cards can be described as:
where N_group_size is the number of cards per group. Because we know the number of board (tableau) cards and groups through level design, we can calculate the average group size:
At this point, it is also possible to calculate the average number of groups that become visible based on the average number of open cards. For example, even if 10 groups are defined at the beginning, only 3 groups may be visible at any given state:
where N_avg_groups is the average number of visible groups, N_avg_open_cards is the average number of open cards at any state, and N_avg_group_size is the average number of cards per group.
We will use these equations in the next sections to calculate required amount of stockpile for any configuration.
3. Effect of the Hold Slot Use
Decreasing the number of unique cards per group increases the use of hold slots due to the increasing number of duplicate cards:
There are 2 ways to use the hold slot:
Any 2 groups can be connected by a missing number that creates a consecutive sequence.
Duplicate cards in a group can be collected for groups with a size greater than 2.
Then, equation becomes:
where N_avg_hold_slot_use is the maximum number of possible hold slot uses and p_hold_slot_use is the probability of hold slot use for a player. The reason we divided it into 2 is that we cannot use the hold slot for both conditions at the same time.
4. Stockpile Requirement
Another important variable that level designers should be aware of is the number of stockpile uses required. An increased requirement for stockpile use is generally related to level difficulty and provides insights to the level designer.
where p_stockpile is the probability of matching cards coming from the stockpile.
It is also possible to calculate the max expected stockpile use:
5. Consecutiveness
Consecutiveness is a measure of consecutive matches on the board in a row. If you watch the video, you will see that there are 17 matches on the board (excluding the first collected card), and its consecutiveness is 1 since we can collect all at once.
We can calculate the consecutiveness as a configuration variable:
and we can also use the following formula to compare simulation results:
It is also possible to measure the effect of the hold slot use after the simulation is completed:
Keep in mind that when I use consecutiveness as a configuration variable, the availability of hold slot use isn't considered, as its effect can only be measured after its use. We will compare c_sim, c_sim_hold_slot and c_config in the Monte Carlo Simulations section.
Another related measurement is the average number of consecutive matches. Different from consecutiveness, we can define consecutive matches based on the number of cards matched in a row, except the first card. Its calculation, on the other hand, cannot be easily made by a simple approximation due to its recursive nature. Consider the following example:
Open Cards: [1, 2, 3]
The waste pile card should match with either 1, 2, or 3.
There are 2 ways to have 3 consecutive matches in a group:
1 → 2 → 3, no card left
3 → 2 → 1, no card left
There are 2 ways to have a 2 consecutive matches in a group:
2 → 3, 1 left
2 → 1, 3 left
There are 2 ways to have a 1 card in a group, if the previous chain has 2 cards.
Probabilities: 67% 3 consecutive matches, 33% 2 consecutive matches and 33% 1 match only. Keep in mind that P(1 match | 2 matches) is 33%, so if you want to calculate the overall probability, you should sum the probabilities of 3 and 2 consecutive matches, which equals 100% as expected.
What if we have more than 3 open cards? This will lead to multiple branching possibilities each time the player chooses a path. I handled it with a recursive algorithm, and I discussed the results in the Monte Carlo Simulations section.
6. Effect of Obstacles
Obstacles are not only meant to keep players engaged with new content, but they are also crucial in level design when you want to create specific paths for booster use, as well as to balance the level difficulty. They are vital for monetization and can be very powerful when used effectively. However, it can also easily become a nightmare for level designers if the possible outcomes cannot be foreseen during the level design, such as whether a solution is available or the potential ways the level could be failed related to obstacle placement.
Brick Wall Obstacle
Specific to this article, I created a brick wall obstacle that requires players to completely break it in order to open the card behind it. When the player collects a card, all brick wall obstacles in the front line take damage. A total of 3 damage is needed to break it completely.

Normally, it is expected to flip the card behind immediately when it is no longer blocked by a wall piece. However, I avoided adding such additional details to focus on the main goal of this article. Therefore, if you notice in the videos that a card is not flipped even though the wall piece is removed in front of it, this is the reason.
You can watch the video below to see how it works. We will also discuss its effects in the simulations later.
Auto-Rank Generation Algorithm
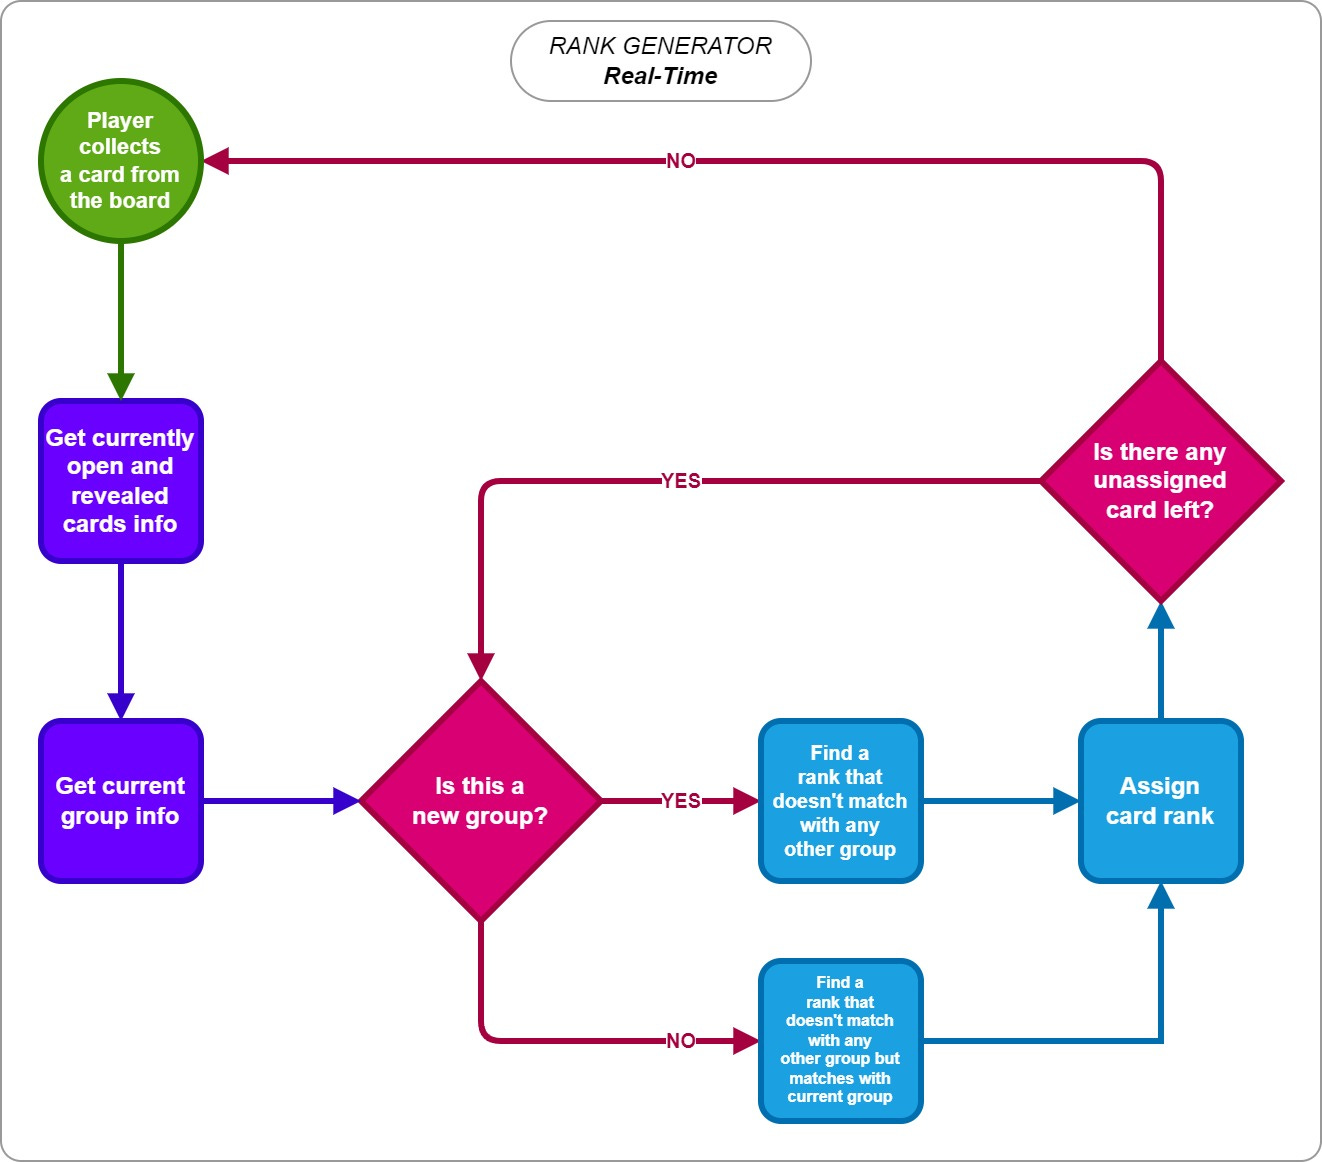
Although the rank generation algorithm itself is easy to follow, as shown in the flowchart, the tricky part arises when a new group is created. The challenge is to find a random non-matching rank while ensuring that its neighbors also have the potential to avoid matching with other existing groups. There are several possible approaches, including ignoring future groups' rank intersections. However, my approach is to find the farthest non-matching numbers in a cyclic group (since A and K are also neighbors), so that it can maximize the separation between existing and upcoming groups. For example:
[A, K, Q, J, 10, 9] is current group on the board.
Available non-matching ranks are 3, 4, 5, 6, and 7. Normally, we could randomly select any of these values for the new group.
5, on the other hand, is the farthest rank, so the algorithm chooses it.
At some point, however, assigning a random rank may become unavoidable and it directly affects the consistency between theoretical and real results. This is why the number of cards, obstacle placements, average number of open cards, number of groups, and group sizes become very significant.
Monte-Carlo Simulations
Monte Carlo simulation is a very useful technique when you need to observe a system's behavior with given initial parameters. You can either run it with a mathematical model or a computational model.
Simulations help create solid hypotheses that provide a basis for a better-structured A/B test, rather than trial and error, which causes the loss of money and most importantly, time.
A tripeaks solitaire game, in our case, requires a computational model to imitate the game so that we can create scenarios close enough to real-life situations. As you read, we have already discussed the theoretical facets of the system, and in this section, we will test them against the simulation results.
There are 4 main parts in the simulation system:
Core system, which includes all group-based randomization and related algorithms.
Game system, which includes everything about the game logic that imitates tripeaks solitaire.
Player model, which emulates player behavior based on a given decision-making logic.
Simulation environment, which connects all modules to run the simulation.
I used Python for the simulation and Unity for level design. The core system is also implemented in Unity to record the gameplay videos shown throughout this article.
These initial parameters are given to run the simulation:
Level configuration: they are generated from Unity.
Number of players.
Max iteration per player: we don’t want players try to complete the game forever if they somehow stuck.
Groups, as we discussed in Group-Based Randomization section.
Shuffle groups.
Stockpile matching probability parameters, based on constrained randomization.
Hold slot use probability.
Consecutiveness (calculated only for the probabilistic card generator model): This parameter represents the probability of generating a matching card between board cards. For example, if it is 1.0, it means that each next card will have a match with an open card on the board. Its value is calculated as shown in the Consecutiveness section.
Level configurations, groups, hold slot use probability, and consecutiveness change with different experiments. The number of players, max iterations per player, shuffle groups and stockpile matching probability are the same for all simulations. Their values are 1000, 1000, True and 1, respectively. Stockpile matching probability is always set to 1 to remove its effect on the number of stockpile cards drawn per player. Groups are always shuffled for each player to ensure that different players encounter different variations of the same level as much as possible.
1. Player Algorithm
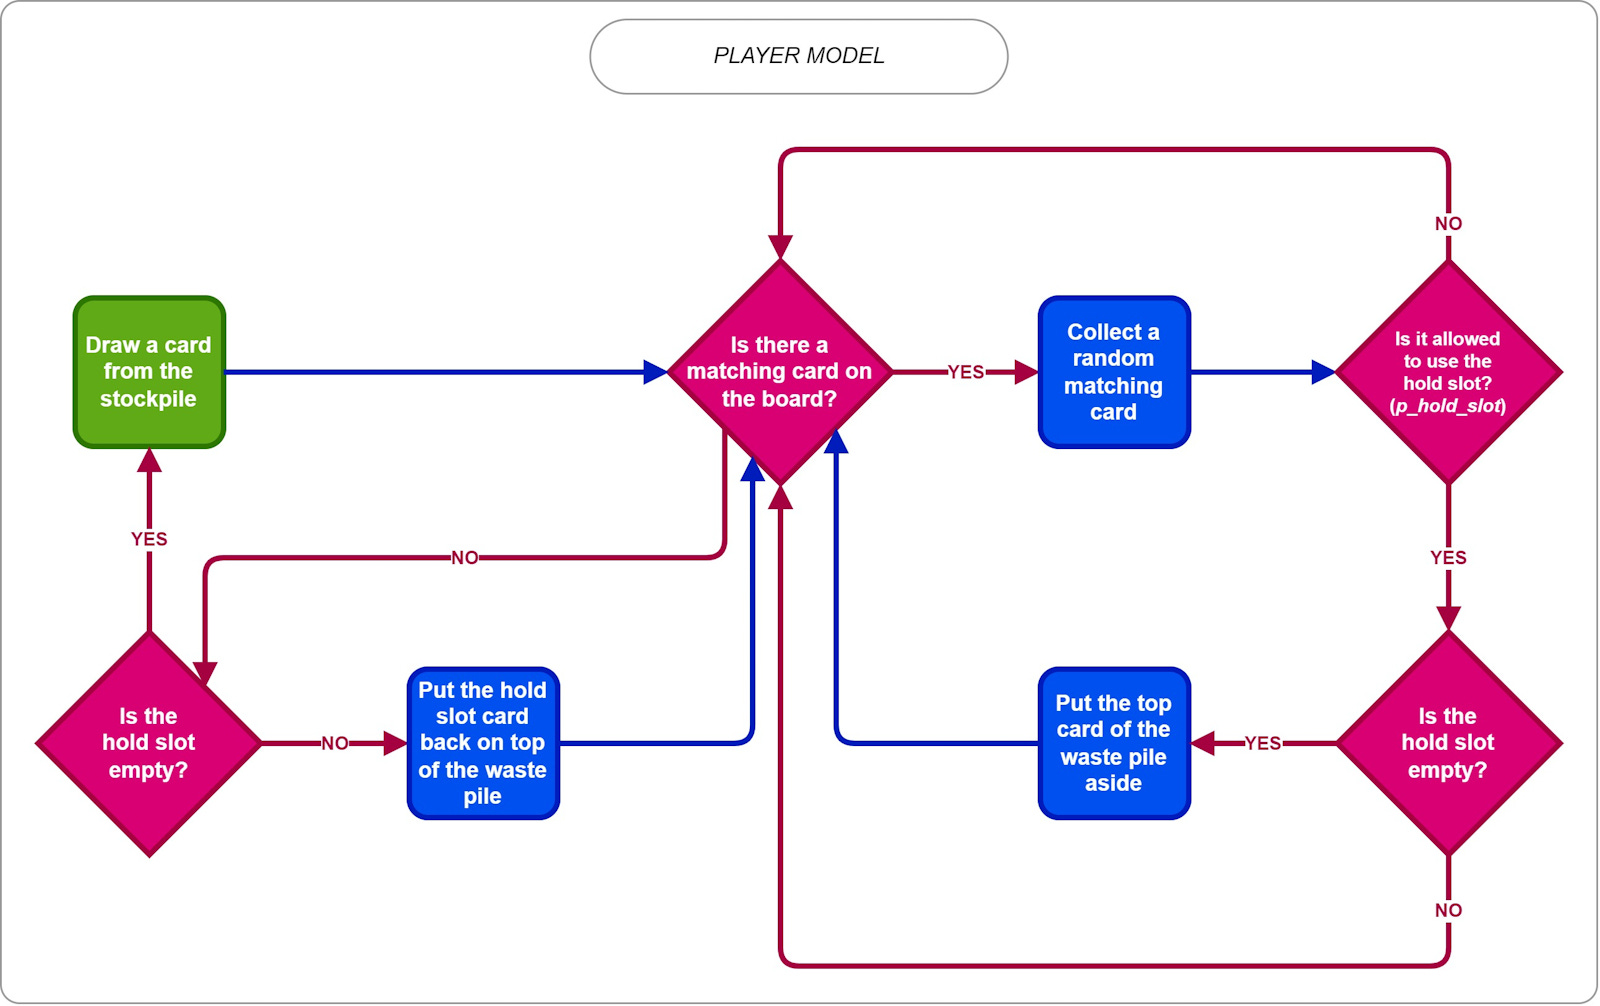
As shown in the flowchart, players are not trying to find the best path, instead, they are playing randomly, in a way that makes sense from a logical perspective. Hold slot use depends on the probability, p_hold_slot, given in the configuration.
2. Simulation Results
In this section, you will find the initial configurations, simulation results, comparisons with theoretical calculations, and gameplay records of the levels simulated.
Simulation 1: Comparison with the Probabilistic Card Generator Model
So, you may think that what’s the point of creating a structured system while we can just use a purely probabilistic method while generating the ranks. Why do we need to invest time, when it is nearly as easy as writing, “I want the matching probability of the next opened board card to be 50% with another board card”?
Look at the videos below. The first one is completely based on a probabilistic model:
And the one below is the structured one that we discussed:
Did you notice any difference? It's hard to tell, except that I clearly drew 2 more cards in the group-based model. This is the main reason why so many of us don’t care too much about how the model will affect the result: because, obviously, we can’t just tell by playing it ourselves, and this can end with a very unpleasant result.
Let's first look at the configurations:
Level configuration: layout is as shown in the video. 24 cards in total.
Groups: 4 repeating groups with sizes: 6, 3, 2 and 1, which include both long and short group sizes. 6 is selected for the longest group to avoid exceeding the total number of unique cards (13 in total, from A to K) because these groups are repeating, and 2 groups of size 6 make a total of 12 cards. The total sizes of the other groups are also selected as 3, 2, and 1 for the same reason, and their total again equals 6. The total size of the first and second groups becomes 9, which is the max number of open cards that can be visible by design.
Hold slot use probability: 0.
Consecutiveness: 0.7 (calculated, only for probabilistic model).

The longest chain is the maximum consecutive matches made by a player until the level is completed. As shown in the chart above, 77% of the players gather around 6 in the group-based model, if we allow a ±1 tolerance in length and this value is 54% for the probabilistic model. While only 7% of the players in the group-based model exceed 7, this is 38% for the probabilistic model. So, if you design a level expecting most players to collect a max of 6 cards in a row, think twice if you are using the probabilistic model!
The theoretical average consecutive matches value is calculated as 1.1, while it results in 1.5 for the group-based model and 2.0 for the probabilistic model.

The number of cards drawn from the stockpile is the core of level monetization, and it is normally one of the easiest configurations you can adjust. If you know your level needs 10 cards to solve, you may start the level with 9 cards, giving you a chance to encourage players to spend currency for extra cards. If you want a real example, read the sections starting with Data Collection Methodology of the Candy Crush Solitaire Deconstruction and Experimenting with Auto-Level Generation article.
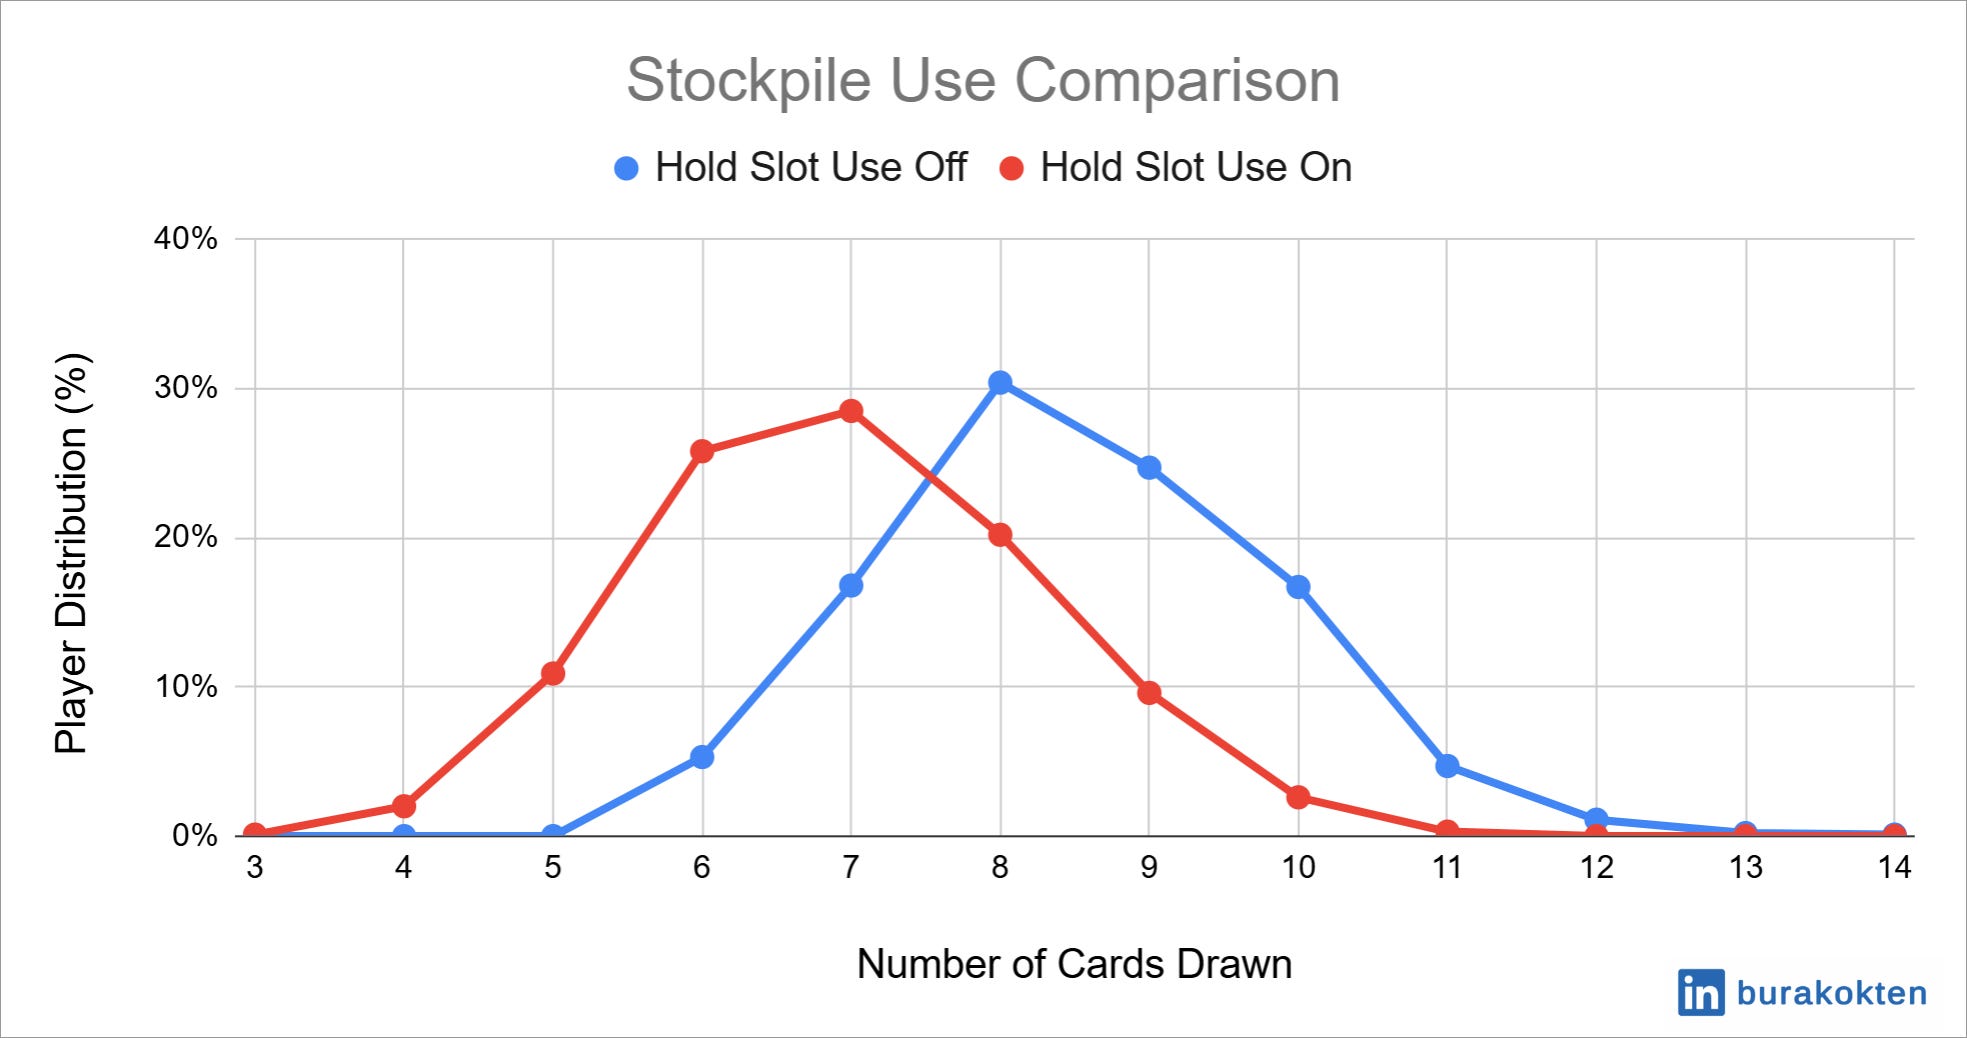
Look at the stockpile use comparison chart. Theoretical min and max values are calculated as 8 and 14, respectively. Therefore, if you are designing a level, you should expect most players to spend within this range. 96% of players in the group-based model fall within this range, while 69% of players in the probabilistic model do. However, this isn’t the worst part: 30% of players in the probabilistic model don't even need to spend the theoretical min amount of stockpile cards, while it is only 3% for the group-based model. Do you really want to give up 30% of the players? They won’t even need to use any boosters!
I assume that we’ve agreed on why a structured model is better than a purely probabilistic model. Now, we can start exploring the behavior of the group-based model with different configurations.
Simulation 2: Long Groups
Long groups are generally the safest when generating ranks when they used with other long groups, because it is possible to duplicate numbers to avoid intersecting with other groups. We will examine this scenario in this simulation.
Level configuration: layout is as shown in the video. 24 cards in total.
Groups: 3 repeating groups with sizes of 8.
Hold slot use probability: 0.5 for hold slot use on.

I included hold slot use because I was very curious about how it would affect the result. When hold slot use is enabled, it is used an average of 2.7 times in this simulation.
If we again consider the longest group, which is 8, and also include 7 and 9 with a tolerance, 75% of the “hold slot use off” players gather around it, while this percentage is 82% for “hold slot use on” players. Nearly 25% of the “hold slot use off” players fall below 7, while this is only 5% for “hold slot use on” players.
The main reason is that when we increase the size of the group, the probability of having a matching waste card with a rank in the middle of the group increases, causing it to behave like 2 separate, neighboring groups. Hold slot use, on the other hand, unites these groups again.
We can look at the average consecutive matches to see the overall picture. It is calculated as 2.5 theoretically and results in 3 and 4.5 for the “hold slot use on” and “hold slot use off” scenarios, respectively.

Theoretical stockpile use is calculated as min 3 and max 12 for “hold slot use off“ and min 1.8 and max 12 for “hold slot use on”. Due to the increasing matching probability of middle cards, theoretical max tries to handle the worst case scenario, which is nearly not happening as in the chart.
Average stockpile use is 6.4 for “hold slot use off“ while it is 4.7 for “hold slot use on“.
Simulation 3: Short Groups
When we decrease the group size while also increasing the number of groups, it is possible to bump into the scenarios where avoiding intersections or neighbor ranks is impossible. In this simulation, we will test this.
Level configuration: layout is as shown in the video. 24 cards in total.
Groups: 3 repeating groups with sizes of 4.
Hold slot use probability: 0.5 for hold slot use on.

As seen in the chart, 86% of “hold slot use off” players reach a longest chain of 4, increasing to 96% when including a tolerance of ±1. For the “hold slot use on” players, these values are 44% and 53% respectively. We see a peak at 8, with nearly 25% of “hold slot use on” players, because it connects 2 groups.
The hold slot use average is again 2.7 as in the long group configuration.
Theoretical consecutive matches value is calculated 1.8, while simulation results are 1.9 and 2.6 for “hold slot use on” and “hold slot use off” cases, respectively.
Theoretical min and max stockpile use values are 6 and 12, respectively, for the “hold slot use off” case, while it is 3.2 and 12 for “hold slot use on”. Average number of cards drawn drops from 8.5 to 6.9 when hold slot use is enabled.
When we consider all theoretical calculations, they seem to construct a solid base overall, providing enough insights to begin.
Simulation 4: Effect of Obstacles
As we discussed in the previous sections, obstacles can easily cause a level to fail, even if you think there is a solution. The best way to experiment with these cases is to use a simulation for testing.
Watch the following videos. A solution, most of the time, is possible:
However, the obstacle mechanic and its placement can lead to paths that are not possible to solve:
Regardless of whether you are designing the level with the intention of having several paths to fail states, which is expected (otherwise, we couldn’t challenge the players), we should know what percentage of players will face this situation. In this experiment, we will examine it.
Level configuration: layout is as shown in the video. There are 24 cards with 5 brick wall obstacles.
Groups: 12 groups with sizes 4, 3, 2 and 1. There are 7 groups with size 2 and 3 groups with size 1.
Hold slot use probability: 0.
Simulation results showed that 89% of the players completed the level successfully, while 11% failed. A hammer booster would be very useful for these failed players.
Theoretical consecutive matches value is calculated as 0.8, while the simulation result is 0.9. Theoretical min and max for stockpile use are calculated as 12 and 14, covering 77% of the successful players. There are 15% of players who draw less than 12 cards, which is a bit more than expected. The main reason is that theoretical calculations don’t account for obstacle use, and it would be good to consider the equations based on the introduced obstacle mechanics.
Simulation 5: Effect of the Number of Open Cards
In this section, we will discover how the average number of open cards affects consecutive matches and stockpile use.


In total 7 card layouts tested with 3 different group configurations:
Level configuration: 7 layouts as in the images below. It is assumed that “1, 2, 3, 4, 6, 8 and 12” cards are open on average for each layout.
Groups: Balanced (from simulation 1), Long (from simulation 2) and Short (from simulation 3).
Hold slot use probability: 0.

Consecutive matches peak when there is only 1 card open, as expected, because the player has no choice other than collecting the only open card.
There is a decline when we start to increase the average number of open cards until 4, because the stockpile deck now has more choices to match with a card from the board, causing fragmentation of the groups.
After 6, we start to see an increment. The main reason is that random ranks start to rise, as it becomes unavoidable to find a rank that is not neighboring two different groups.
Long groups cannot maintain their group sizes when the number of open cards increase because of the fragmentation we discussed in the Simulation 2: Long Groups section.
Balanced groups performs well with minimal change. Consecutive match loss percentage based on the max value for each configuration in the worst case scenario:
30% for balanced groups config.
59% for long groups config.
47% for short groups config.

When there is only 1 card open on the board, we see the minimum number of stockpile uses, as expected, because only 1 stockpile card is enough to collect each group cards.
Balanced groups config requires more cards, as its average group size is 3, shorter than the average of the short groups config, even though it includes a longer group size.
If we consider that most levels vary between 3 to 6 open cards on average, both charts show that groups have a minimal impact on consecutive matches and the average number of cards drawn. Unless it is a custom rank design, we should expect no major change in these values just by changing the number of open cards.
It would definitely be better to experiment with more configurations. However, I believe it is enough for the context of this article.
As we experienced with simulations, most of the time theoretical calculations give results close to those of the computational model. This means that we can keep the chance factor in the levels while predicting and controlling the outcome.
I believe you enjoyed reading the article. Although it is a highly technical post, I tried to minimize the use of technical terms as much as possible for a better readability. You are welcome to ask questions if you have something in mind you are curious about.
Thanks and see you next time!